

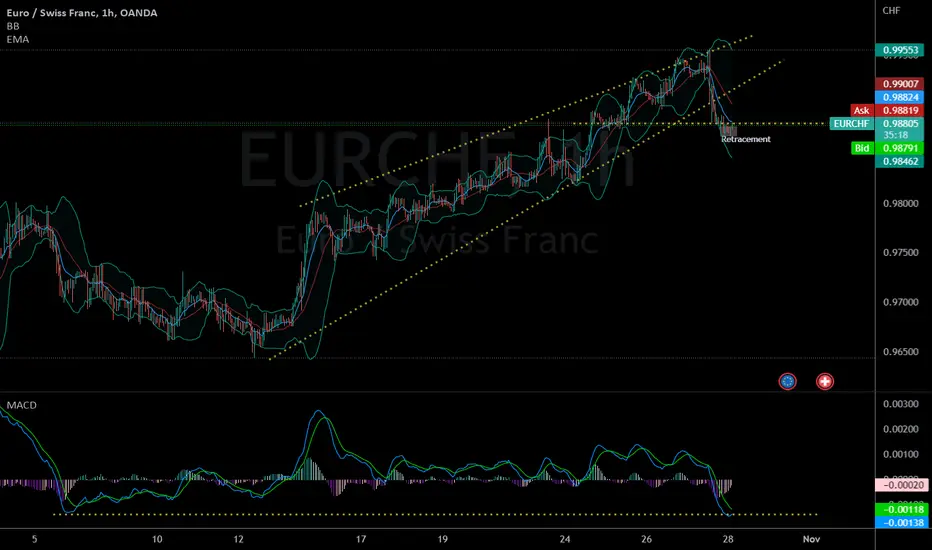
We'd a ascending channel with a resistance making higher highs, however the bottom line of support of the channel was crossed. So we put a horizontal support, to check what could happen to the price, and with this support we can see a possible retracement.
We can also see the EMA line is changing the direction. And about the MACD indicator, the support had already been touched and both lines are changing the direction
And if you zoom the chart, you'll the before the full body bullish candle we and an inverted hammer during the downtrend, so we have some informations where this trend could truly change the directions and go in a Long strategy
We can also see the EMA line is changing the direction. And about the MACD indicator, the support had already been touched and both lines are changing the direction
And if you zoom the chart, you'll the before the full body bullish candle we and an inverted hammer during the downtrend, so we have some informations where this trend could truly change the directions and go in a Long strategy

Instagram: afcapital
免責事項
これらの情報および投稿は、TradingViewが提供または承認する金融、投資、取引、またはその他の種類の助言もしくは推奨であることを意図したものではなく、またこれらに該当するものでもありません。詳細は利用規約をご覧ください。
Instagram: afcapital
免責事項
これらの情報および投稿は、TradingViewが提供または承認する金融、投資、取引、またはその他の種類の助言もしくは推奨であることを意図したものではなく、またこれらに該当するものでもありません。詳細は利用規約をご覧ください。