

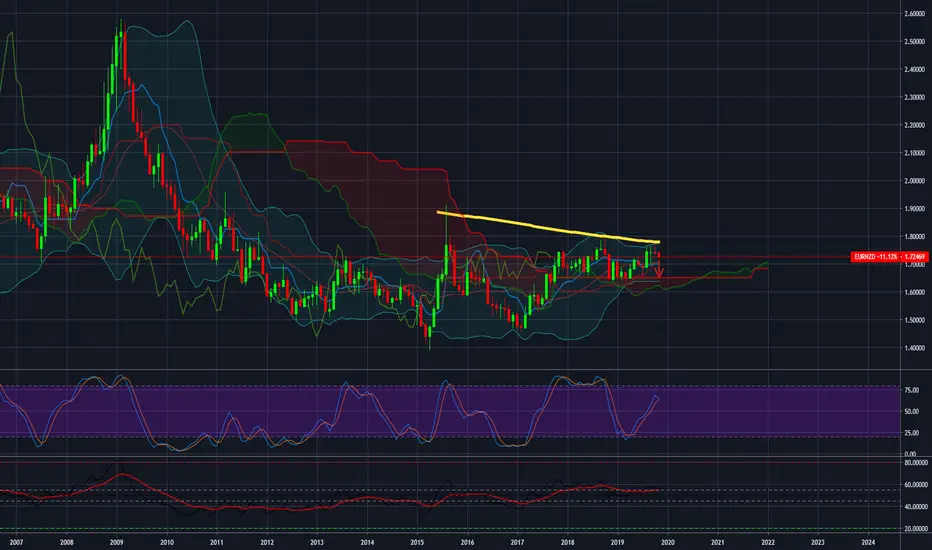
We usually prefer to analyze graphs in D1 but this pattern in the monthly graph forces us to write about it.
2 Doji candlestick symbolizing a trend ending (to confirm the current candle theory should close in red ... got off to a good start)
The 200 moving average line synchronizes with the resistance line at 1.7760.
This is the third time eurnzd has touched the average line and is responding to declines.
Target: 1.7110
2 Doji candlestick symbolizing a trend ending (to confirm the current candle theory should close in red ... got off to a good start)
The 200 moving average line synchronizes with the resistance line at 1.7760.
This is the third time eurnzd has touched the average line and is responding to declines.
Target: 1.7110

免責事項
これらの情報および投稿は、TradingViewが提供または承認する金融、投資、取引、またはその他の種類の助言もしくは推奨であることを意図したものではなく、またこれらに該当するものでもありません。詳細は利用規約をご覧ください。
免責事項
これらの情報および投稿は、TradingViewが提供または承認する金融、投資、取引、またはその他の種類の助言もしくは推奨であることを意図したものではなく、またこれらに該当するものでもありません。詳細は利用規約をご覧ください。