

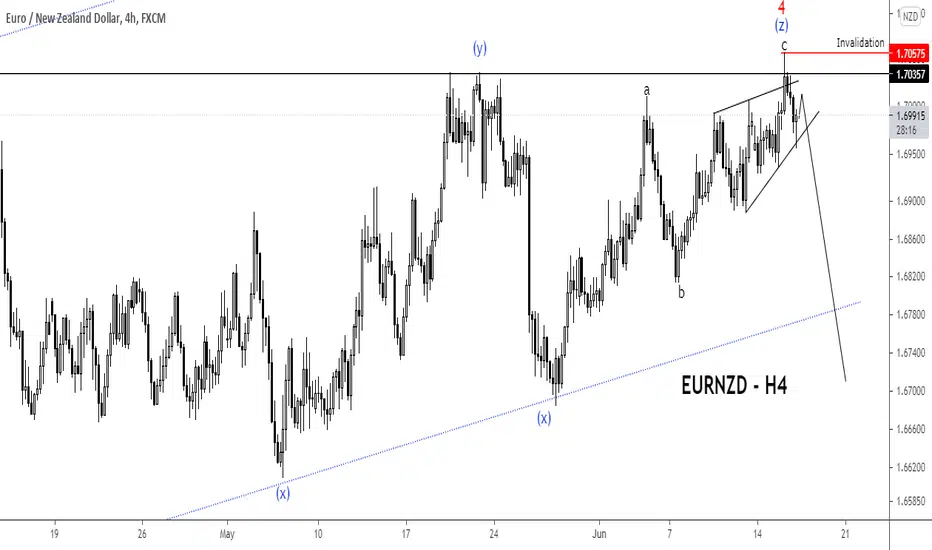
EURNZD has been in a corrective since February and seems to be topping out now.
The correction unfolded as a double zigzag pattern and the third zigzag is visible on this H4 chart above.
Wave c of (z) of 4 also unfolded as an ending diagonal which is a reversal pattern.
If this count is correct, any further rally must stay below the invalidation level on the chart and the price should head lower in a five-wave sequence.
Higher degree chart:
s3.tradingview.com/snapshots/x/X0SAc3i8.png
What's your view on EURNZD? Let me know in the comment.
The correction unfolded as a double zigzag pattern and the third zigzag is visible on this H4 chart above.
Wave c of (z) of 4 also unfolded as an ending diagonal which is a reversal pattern.
If this count is correct, any further rally must stay below the invalidation level on the chart and the price should head lower in a five-wave sequence.
Higher degree chart:
s3.tradingview.com/snapshots/x/X0SAc3i8.png
What's your view on EURNZD? Let me know in the comment.

免責事項
これらの情報および投稿は、TradingViewが提供または承認する金融、投資、取引、またはその他の種類の助言もしくは推奨であることを意図したものではなく、またこれらに該当するものでもありません。詳細は利用規約をご覧ください。
免責事項
これらの情報および投稿は、TradingViewが提供または承認する金融、投資、取引、またはその他の種類の助言もしくは推奨であることを意図したものではなく、またこれらに該当するものでもありません。詳細は利用規約をご覧ください。