

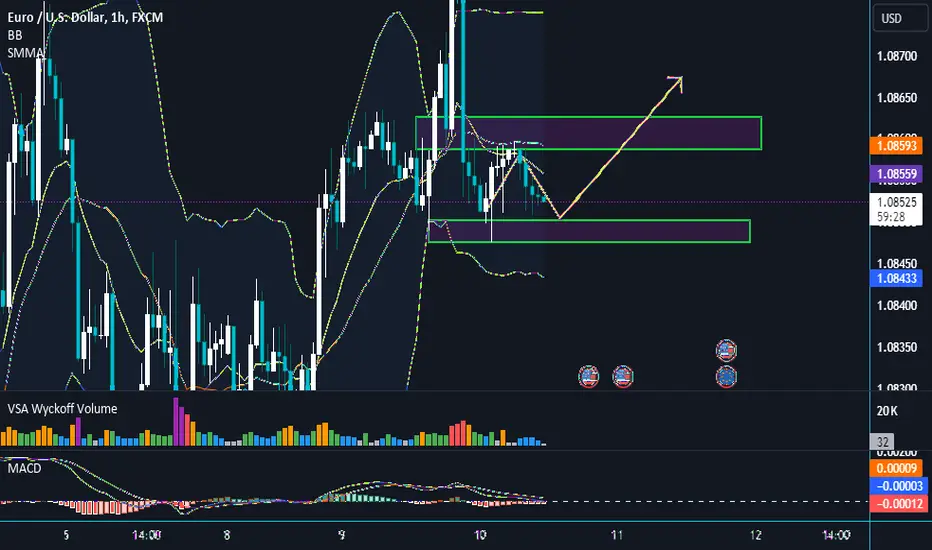
What you've just observed is the basics of bouncing back from the Bollinger Bands. The reason for this bounce is because these bands act as dynamic support and resistance. The larger the time frame you use, the stronger the support and resistance from the bands. Many traders have developed trading systems based on this factor. This trading system works best when the market is trendless and moving sideways.From the chart above, you can see that when the fast line crosses down below the slow line, it has helped identify a new downtrend. Note that when this crossover occurs, the histogram part has not yet appeared. This is because right at the crossover point, the difference between the fast line and the slow line is 0, so there is no histogram.
ノート

関連の投稿
免責事項
これらの情報および投稿は、TradingViewが提供または承認する金融、投資、取引、またはその他の種類の助言もしくは推奨であることを意図したものではなく、またこれらに該当するものでもありません。詳細は利用規約をご覧ください。
関連の投稿
免責事項
これらの情報および投稿は、TradingViewが提供または承認する金融、投資、取引、またはその他の種類の助言もしくは推奨であることを意図したものではなく、またこれらに該当するものでもありません。詳細は利用規約をご覧ください。