

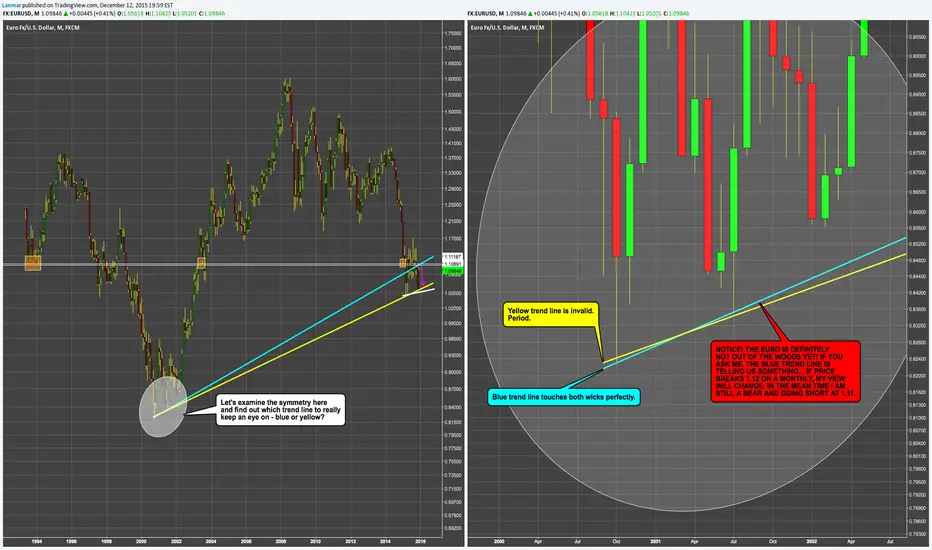
I have seen countless charts for the Euro with trendlines that are typical to the yellow one I drew - they all hit somewhere at 1.05. If you trade using trendlines or incorporate them in your analysis, then you have be as objective as possible with them. The only way we could really be objective about trendlines is by perfectly lining up price points. Using that logic, here is where the Euro stands with regard to the monthly trendline from early 2000/2001.
My trade:
Short @ 1.11
Stop @ 1.12
Target - small time frame determined
My trade:
Short @ 1.11
Stop @ 1.12
Target - small time frame determined
ノート

関連の投稿
免責事項
これらの情報および投稿は、TradingViewが提供または承認する金融、投資、取引、またはその他の種類の助言もしくは推奨であることを意図したものではなく、またこれらに該当するものでもありません。詳細は利用規約をご覧ください。
免責事項
これらの情報および投稿は、TradingViewが提供または承認する金融、投資、取引、またはその他の種類の助言もしくは推奨であることを意図したものではなく、またこれらに該当するものでもありません。詳細は利用規約をご覧ください。