

📊 Technical Analysis
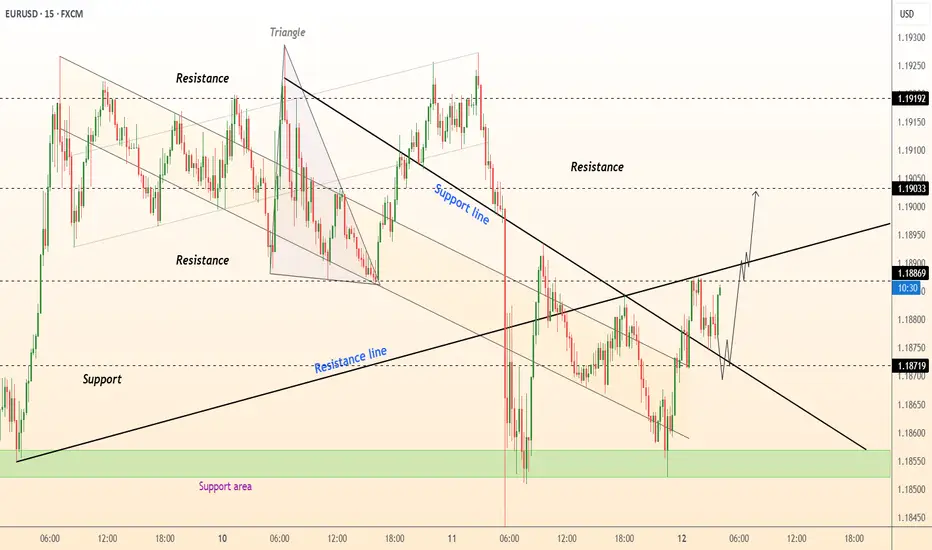
● Descending triangle breakout confirmed. Price breached upper resistance (1.19192) after repeated tests, with bullish candlestick close above the line. Volume/volatility expansion supports validity .
● Higher lows structure and price holding above support area. Wave count suggests start of impulsive leg towards 1.19033.
💡 Fundamental Analysis
● ECB rate pause (2.00%) through 2026 vs. rising Fed cut bets. Real yield differential narrows, supporting euro. US fiscal/debt concerns further weigh on dollar .
✨ Summary
Long from 1.18869. Objective: 1.19033, then 1.19192.
-------------------
Share your opinion in the comments and support the idea with a like. Thanks for your support!
● Descending triangle breakout confirmed. Price breached upper resistance (1.19192) after repeated tests, with bullish candlestick close above the line. Volume/volatility expansion supports validity .
● Higher lows structure and price holding above support area. Wave count suggests start of impulsive leg towards 1.19033.
💡 Fundamental Analysis
● ECB rate pause (2.00%) through 2026 vs. rising Fed cut bets. Real yield differential narrows, supporting euro. US fiscal/debt concerns further weigh on dollar .
✨ Summary
Long from 1.18869. Objective: 1.19033, then 1.19192.
-------------------
Share your opinion in the comments and support the idea with a like. Thanks for your support!

関連の投稿
免責事項
これらの情報および投稿は、TradingViewが提供または承認する金融、投資、取引、またはその他の種類の助言もしくは推奨であることを意図したものではなく、またこれらに該当するものでもありません。詳細は利用規約をご覧ください。
関連の投稿
免責事項
これらの情報および投稿は、TradingViewが提供または承認する金融、投資、取引、またはその他の種類の助言もしくは推奨であることを意図したものではなく、またこれらに該当するものでもありません。詳細は利用規約をご覧ください。