

EURO/USD
RSI SIGNAL ANALYSIS
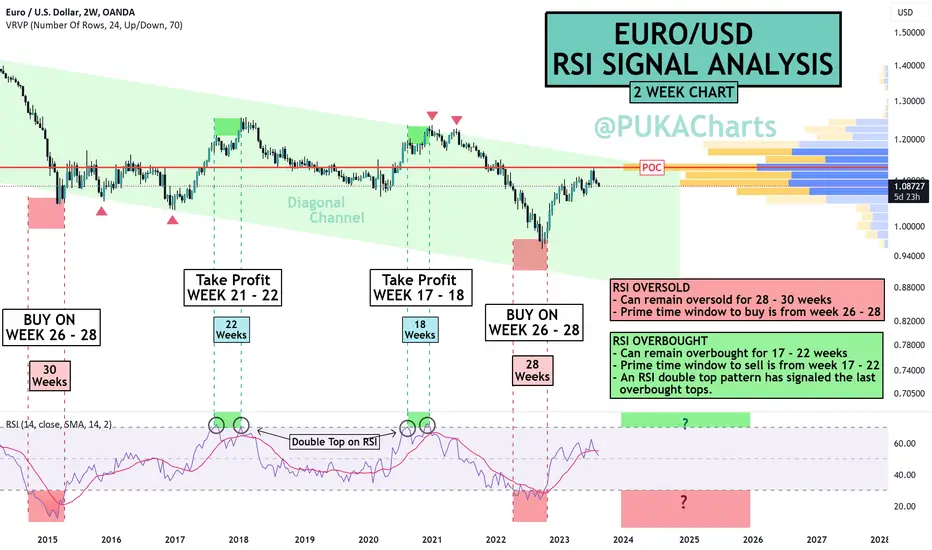
- Diagonal parallel channel acting as confinement zone
for price, good for timing buys/sells and for stops
above or below.
- Red zones on the chart are oversold levels and green
are overbought.
RSI OVERSOLD
- Can remain oversold for 28 - 30 weeks
- Prime time window to buy is from week 26 - 28
RSI OVERBOUGHT
- Can remain overbought for 17 - 22 weeks
- Prime time window to sell is from week 17 - 22
- An RSI double top pattern has signaled the last
overbought tops.
You can also clearly see the relevance of the POC Line which price oscillates around or has trouble with breaching.
We can observe what happens the next time the RSI is oversold or overbought and maybe we can use these weekly time windows to better gauge a buy or sell opportunity.
PUKA
RSI SIGNAL ANALYSIS
- Diagonal parallel channel acting as confinement zone
for price, good for timing buys/sells and for stops
above or below.
- Red zones on the chart are oversold levels and green
are overbought.
RSI OVERSOLD
- Can remain oversold for 28 - 30 weeks
- Prime time window to buy is from week 26 - 28
RSI OVERBOUGHT
- Can remain overbought for 17 - 22 weeks
- Prime time window to sell is from week 17 - 22
- An RSI double top pattern has signaled the last
overbought tops.
You can also clearly see the relevance of the POC Line which price oscillates around or has trouble with breaching.
We can observe what happens the next time the RSI is oversold or overbought and maybe we can use these weekly time windows to better gauge a buy or sell opportunity.
PUKA

免責事項
これらの情報および投稿は、TradingViewが提供または承認する金融、投資、取引、またはその他の種類の助言もしくは推奨であることを意図したものではなく、またこれらに該当するものでもありません。詳細は利用規約をご覧ください。
免責事項
これらの情報および投稿は、TradingViewが提供または承認する金融、投資、取引、またはその他の種類の助言もしくは推奨であることを意図したものではなく、またこれらに該当するものでもありません。詳細は利用規約をご覧ください。