

By taking a deeper look at Daily chart we could easily see a bearish move!
Latest reaction was to top of the channel an we are going to reach to bottom of the channel. However, We see the RSI is forming a trend line which seems hard to be broken down. I think we could see a reversal to MA of RSI. So we might have one or two range days. Therefore we are both ready for Bearish and range days.

By taking a look to 1h chart we could see that a great zone to short the pair is available!
However by breaking the 1.0770 we could consider the trend bullish.

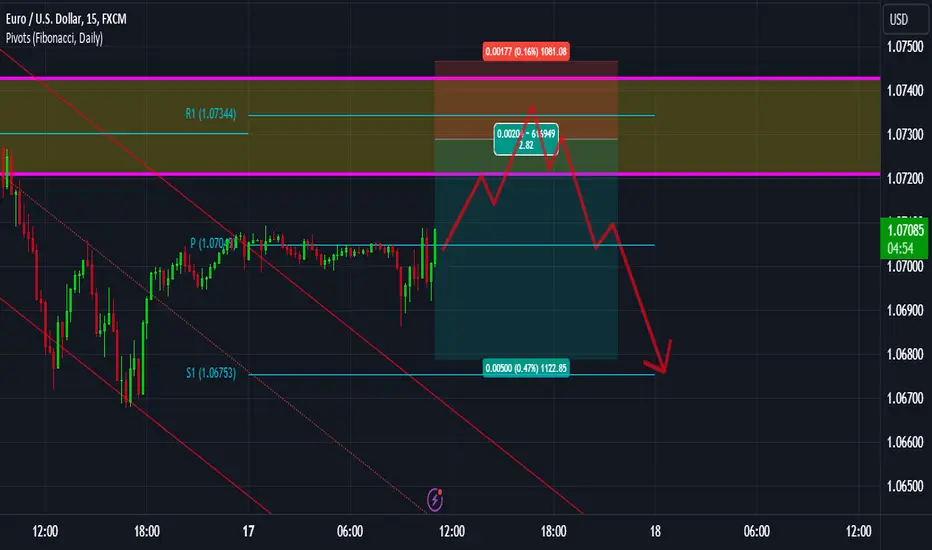
What is obvious in the main chart is that today Fibonacci R1 is in coincide with yesterday Pivot and these two are perfectly in our zone!
I'm waiting to sell from there! the channel in 15m chart could be used as liquidity hunt! These are important levels of today you can search for more reasons or places to short the pair
Latest reaction was to top of the channel an we are going to reach to bottom of the channel. However, We see the RSI is forming a trend line which seems hard to be broken down. I think we could see a reversal to MA of RSI. So we might have one or two range days. Therefore we are both ready for Bearish and range days.
By taking a look to 1h chart we could see that a great zone to short the pair is available!
However by breaking the 1.0770 we could consider the trend bullish.
What is obvious in the main chart is that today Fibonacci R1 is in coincide with yesterday Pivot and these two are perfectly in our zone!
I'm waiting to sell from there! the channel in 15m chart could be used as liquidity hunt! These are important levels of today you can search for more reasons or places to short the pair
ノート
トレード終了: ストップロスに到達

免責事項
これらの情報および投稿は、TradingViewが提供または承認する金融、投資、取引、またはその他の種類の助言もしくは推奨であることを意図したものではなく、またこれらに該当するものでもありません。詳細は利用規約をご覧ください。
免責事項
これらの情報および投稿は、TradingViewが提供または承認する金融、投資、取引、またはその他の種類の助言もしくは推奨であることを意図したものではなく、またこれらに該当するものでもありません。詳細は利用規約をご覧ください。