

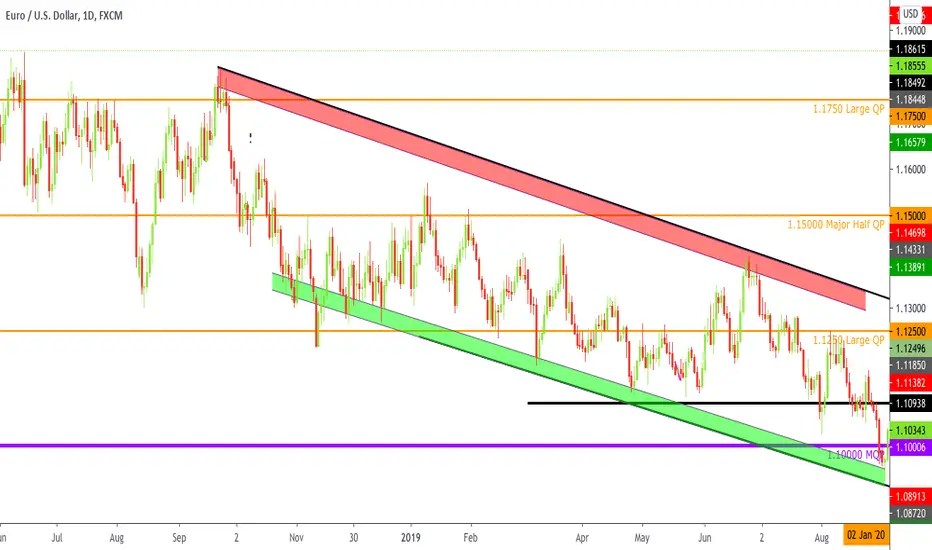
The above chart shows what is called a “channel” in trading. It is basically diagonal support and resistance (a.k.a Trend-lines). The area in between is known as a channel.
The red zone is said to be the perfect entry area for sells whereas the green is for buys.
How To Find The Zones?
Using the “Parallel Lines” tool, draw the diagonal S/R then measure the first candle/wick that starts the channel and that area is where you would get entries with the least possible drawdown.
The red zone is said to be the perfect entry area for sells whereas the green is for buys.
How To Find The Zones?
Using the “Parallel Lines” tool, draw the diagonal S/R then measure the first candle/wick that starts the channel and that area is where you would get entries with the least possible drawdown.

免責事項
これらの情報および投稿は、TradingViewが提供または承認する金融、投資、取引、またはその他の種類の助言もしくは推奨であることを意図したものではなく、またこれらに該当するものでもありません。詳細は利用規約をご覧ください。
免責事項
これらの情報および投稿は、TradingViewが提供または承認する金融、投資、取引、またはその他の種類の助言もしくは推奨であることを意図したものではなく、またこれらに該当するものでもありません。詳細は利用規約をご覧ください。