

EUR Futures
Asset Managers: Strongly net long and continuously increasing since December 2024 → a clear sign of institutional confidence in the euro.
Leveraged Money: Also rising, moving from net short to net long → sentiment reversal even from speculators.
✅ Interpretation: Both institutional categories are bullish on the euro, suggesting potential upward support for EUR/USD.
USD Index Futures
Asset Managers: Decreasing since the end of February → reducing long exposure on the dollar.
Leveraged Money: Recovering from net short, but still uncertain → mixed sentiment.
⚠️ Interpretation: The dollar is structurally weakening. This reinforces the bullish bias on EUR/USD.
🧠 Technical Analysis – EUR/USD Weekly Chart
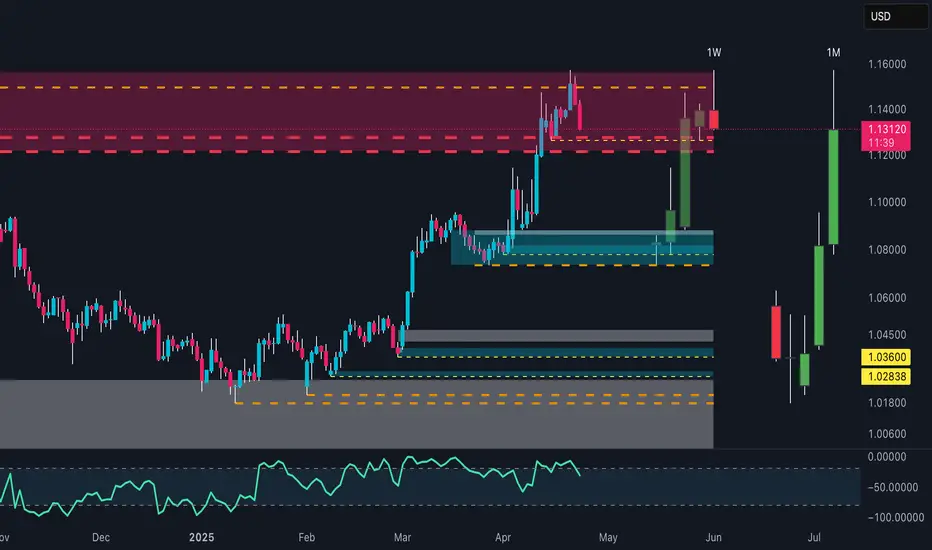
Current price: 1.13150, right in the middle of a weekly/monthly supply zone, marked by upper wicks → clear seller presence.
Price has made a strong rally from 1.03600, breaking through all intermediate supply zones.
RSI: Slightly declining after previously reaching overbought territory.
📌 Key levels:
Major support: 1.1000–1.1080
Structural resistance: 1.1350–1.1450 (current zone)
🧠 Technical Scenario:
If price holds above 1.1250, we could see an extension toward 1.1500.
If it breaks below 1.1200, a pullback toward 1.1080–1.1000 is likely.
✅ Trade Summary:
COT bias: Bullish EUR/USD → strong EUR, weakening USD
Technical: Watch price behavior in the 1.1350 zone → if rejection continues, expect a technical retracement before potential continuation.
🎯 Potential Setups:
Long on pullback toward 1.1080
Breakout long above 1.1450 → targeting 1.1600
Short-term short if bearish price action appears in the current zone
Asset Managers: Strongly net long and continuously increasing since December 2024 → a clear sign of institutional confidence in the euro.
Leveraged Money: Also rising, moving from net short to net long → sentiment reversal even from speculators.
✅ Interpretation: Both institutional categories are bullish on the euro, suggesting potential upward support for EUR/USD.
USD Index Futures
Asset Managers: Decreasing since the end of February → reducing long exposure on the dollar.
Leveraged Money: Recovering from net short, but still uncertain → mixed sentiment.
⚠️ Interpretation: The dollar is structurally weakening. This reinforces the bullish bias on EUR/USD.
🧠 Technical Analysis – EUR/USD Weekly Chart
Current price: 1.13150, right in the middle of a weekly/monthly supply zone, marked by upper wicks → clear seller presence.
Price has made a strong rally from 1.03600, breaking through all intermediate supply zones.
RSI: Slightly declining after previously reaching overbought territory.
📌 Key levels:
Major support: 1.1000–1.1080
Structural resistance: 1.1350–1.1450 (current zone)
🧠 Technical Scenario:
If price holds above 1.1250, we could see an extension toward 1.1500.
If it breaks below 1.1200, a pullback toward 1.1080–1.1000 is likely.
✅ Trade Summary:
COT bias: Bullish EUR/USD → strong EUR, weakening USD
Technical: Watch price behavior in the 1.1350 zone → if rejection continues, expect a technical retracement before potential continuation.
🎯 Potential Setups:
Long on pullback toward 1.1080
Breakout long above 1.1450 → targeting 1.1600
Short-term short if bearish price action appears in the current zone

📈 Nicola | EdgeTradingJourney
Documenting my path to $1M in prop capital through real trading, discipline, and analysis.
Documenting my path to $1M in prop capital through real trading, discipline, and analysis.
免責事項
これらの情報および投稿は、TradingViewが提供または承認する金融、投資、取引、またはその他の種類の助言もしくは推奨であることを意図したものではなく、またこれらに該当するものでもありません。詳細は利用規約をご覧ください。
📈 Nicola | EdgeTradingJourney
Documenting my path to $1M in prop capital through real trading, discipline, and analysis.
Documenting my path to $1M in prop capital through real trading, discipline, and analysis.
免責事項
これらの情報および投稿は、TradingViewが提供または承認する金融、投資、取引、またはその他の種類の助言もしくは推奨であることを意図したものではなく、またこれらに該当するものでもありません。詳細は利用規約をご覧ください。