

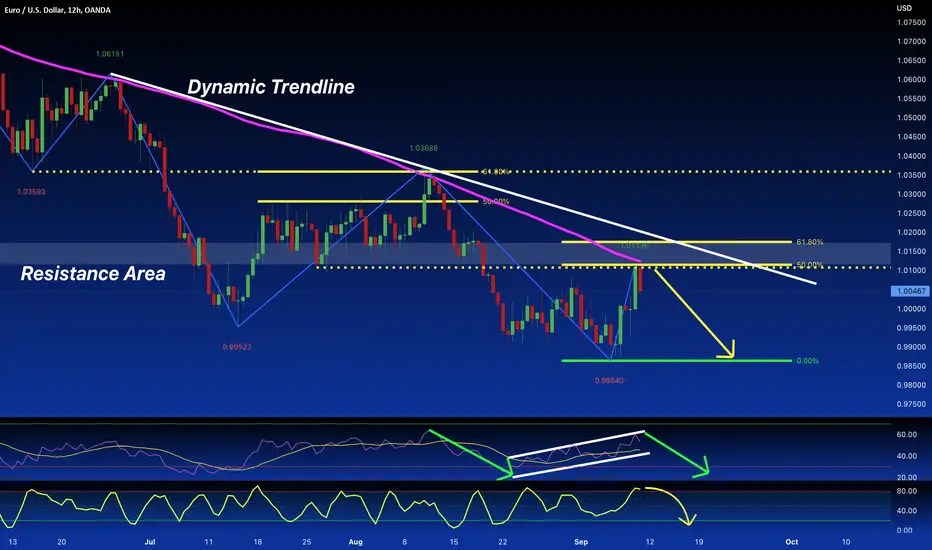
Following our Yesterday idea, the Price has totally fulfilled our prediction about the pullback on the previous 50% - 61.8% Fibonacci level in confluence with the static Resistance line ( dotted line ). The Price yesterday after retesting the area 1.01 finds this talked levels, like a wall to not go over with also the 100 Moving average working as another obstacle for the price. The Stochastic is ready to drop from the overbought meanwhile the RSI form an interesting pattern of breakdown. All these clues make the chart of today: A strong bearish candle.
トレード稼働中
✅ YESTERDAY IDEA...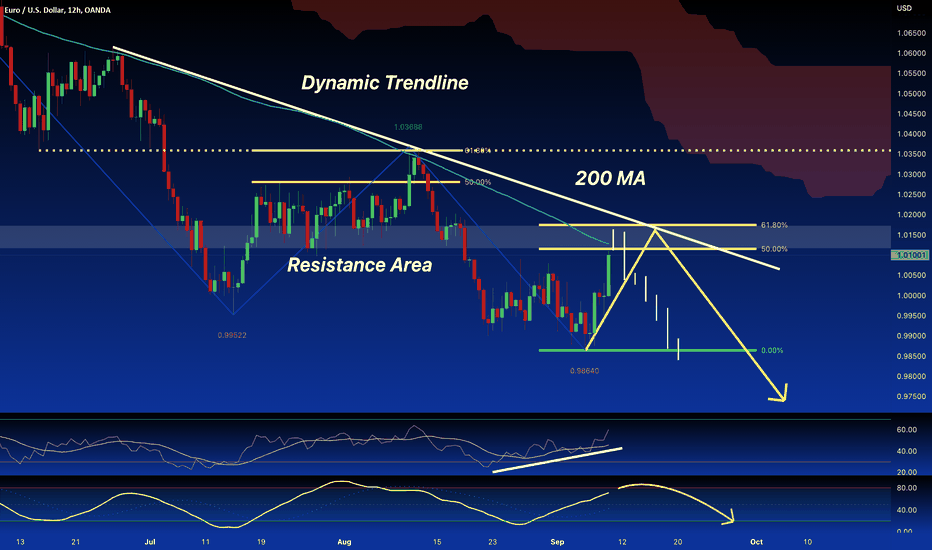
ノート
✅ TODAY... IN PROFIT
関連の投稿
免責事項
これらの情報および投稿は、TradingViewが提供または承認する金融、投資、取引、またはその他の種類の助言もしくは推奨であることを意図したものではなく、またこれらに該当するものでもありません。詳細は利用規約をご覧ください。
関連の投稿
免責事項
これらの情報および投稿は、TradingViewが提供または承認する金融、投資、取引、またはその他の種類の助言もしくは推奨であることを意図したものではなく、またこれらに該当するものでもありません。詳細は利用規約をご覧ください。