

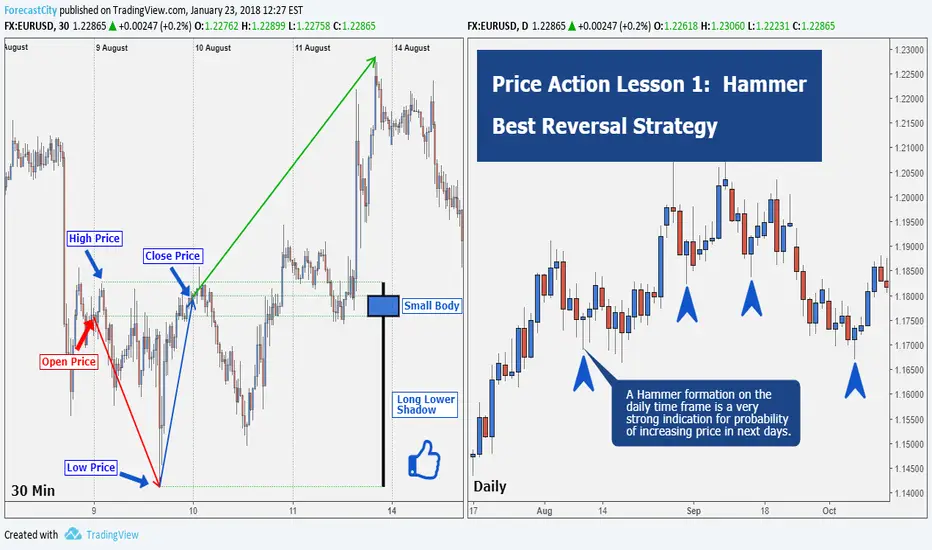
Hammer Candle Stick Definition
If there was a large drop in price in the middle of the day, but before the day ended it increased to what it was at the beginning of the day and even more, a significant upward return occurred. The candlestick of this change (move) will be a Hammer in a daily time frame. A Hammer formation on the daily time frame is a very strong indication for probability of increasing price in next days.
Example: The picture shows currency pair of EUR/USD in a 30 minute time frame. On Ausust 09, 2017 the price significantly decreased from 1.17495 to 1.16886 or even lower. But after that, it increased rapidly at the end of the day to 1.17578 and then closed.
Also in this picture - for better understanding - the Hammer Candlestick in the daily time frame - in the result of changes in a day - is drawn.
If there was a large drop in price in the middle of the day, but before the day ended it increased to what it was at the beginning of the day and even more, a significant upward return occurred. The candlestick of this change (move) will be a Hammer in a daily time frame. A Hammer formation on the daily time frame is a very strong indication for probability of increasing price in next days.
Example: The picture shows currency pair of EUR/USD in a 30 minute time frame. On Ausust 09, 2017 the price significantly decreased from 1.17495 to 1.16886 or even lower. But after that, it increased rapidly at the end of the day to 1.17578 and then closed.
Also in this picture - for better understanding - the Hammer Candlestick in the daily time frame - in the result of changes in a day - is drawn.
ノート
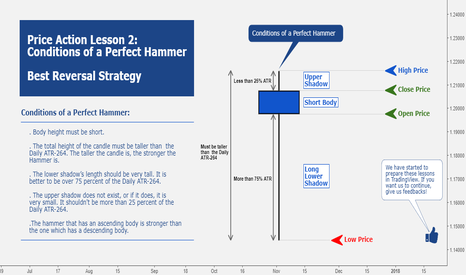
ノート
Price Action Lesson 3: Hammer, The first sign of the beginning Ascending wave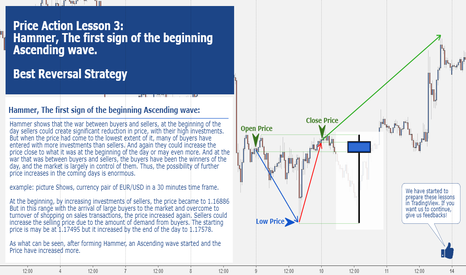
ノート
Price Action Lesson 4: Weak hammer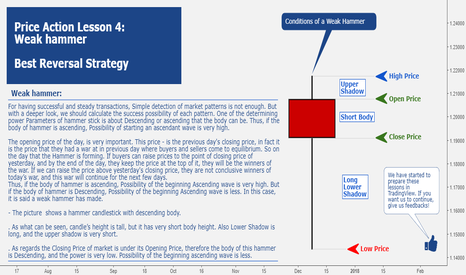
ノート
Price Action Lesson 5: Weak Hammer (Example)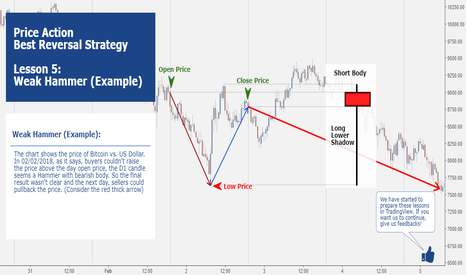

High Accurate forecasts by 4CastMachine AI
✅36 Forex Pairs
✅175 Cryptos
✅16 Indices
✅Gold, Silver...
👉Follow.ForecastCity.com
FREE Telegrams:
👉t.me/ForecastCity_com
✅36 Forex Pairs
✅175 Cryptos
✅16 Indices
✅Gold, Silver...
👉Follow.ForecastCity.com
FREE Telegrams:
👉t.me/ForecastCity_com
免責事項
これらの情報および投稿は、TradingViewが提供または承認する金融、投資、取引、またはその他の種類の助言もしくは推奨であることを意図したものではなく、またこれらに該当するものでもありません。詳細は利用規約をご覧ください。
High Accurate forecasts by 4CastMachine AI
✅36 Forex Pairs
✅175 Cryptos
✅16 Indices
✅Gold, Silver...
👉Follow.ForecastCity.com
FREE Telegrams:
👉t.me/ForecastCity_com
✅36 Forex Pairs
✅175 Cryptos
✅16 Indices
✅Gold, Silver...
👉Follow.ForecastCity.com
FREE Telegrams:
👉t.me/ForecastCity_com
免責事項
これらの情報および投稿は、TradingViewが提供または承認する金融、投資、取引、またはその他の種類の助言もしくは推奨であることを意図したものではなく、またこれらに該当するものでもありません。詳細は利用規約をご覧ください。