

Hello traders,
I uploaded the idea earlier with the GBPJPY chart, so here is the correct one.
Yesterday our Gartley pattern didi it more than great on GBPJPY . See related idea.
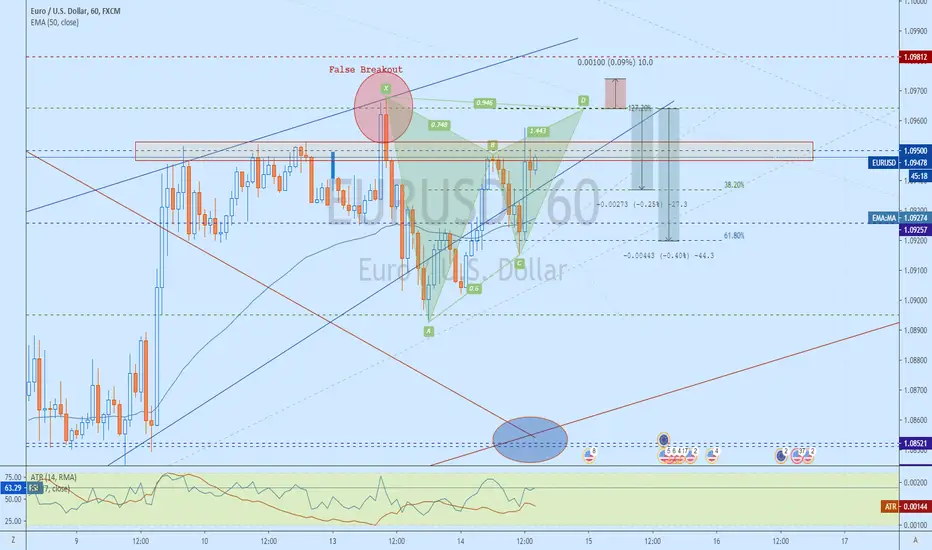
We have a similar trading setup today on EURUSD . Althouth we have to be carrefoul!
If the pattern complete its formation that means that the price has broke above 1.095 which is our resistance.
So we have to keep an eye in lower timeframes to support better our idea. Stop losses very tight in order not to risk if it is an actual break.
Take care
Kind regerds,
Michail Sideris
I uploaded the idea earlier with the GBPJPY chart, so here is the correct one.
Yesterday our Gartley pattern didi it more than great on GBPJPY . See related idea.
We have a similar trading setup today on EURUSD . Althouth we have to be carrefoul!
If the pattern complete its formation that means that the price has broke above 1.095 which is our resistance.
So we have to keep an eye in lower timeframes to support better our idea. Stop losses very tight in order not to risk if it is an actual break.
Take care
Kind regerds,
Michail Sideris
トレード稼働中

免責事項
これらの情報および投稿は、TradingViewが提供または承認する金融、投資、取引、またはその他の種類の助言もしくは推奨であることを意図したものではなく、またこれらに該当するものでもありません。詳細は利用規約をご覧ください。
免責事項
これらの情報および投稿は、TradingViewが提供または承認する金融、投資、取引、またはその他の種類の助言もしくは推奨であることを意図したものではなく、またこれらに該当するものでもありません。詳細は利用規約をご覧ください。