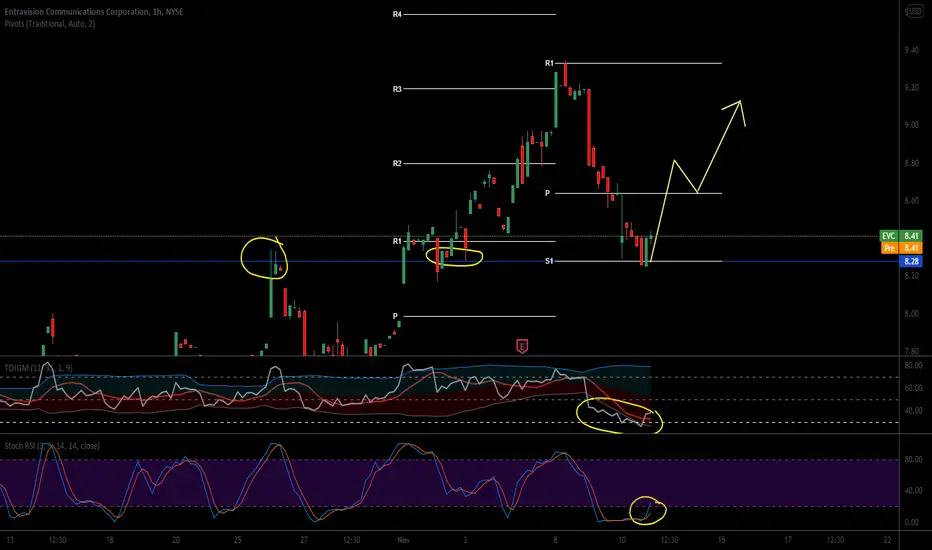
EVC might be ready to run.. The highlighted zone is a support/resistance zone. The furthest yellow circle shows it was retesting then dropped which made it resistance, but the second yellow circle shows it is now support as it closed above and dropped to the highlighted zone, which has been led by 2 bullish engulfing candles on the hourly. You already know about TDIGM and Stoch RSI