ロング
ExideInd1!
27-11
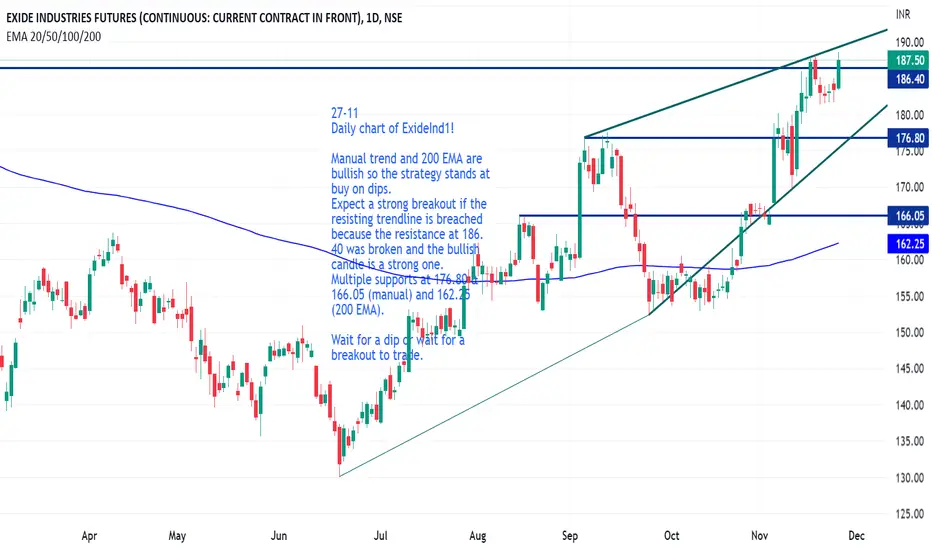
Daily chart of ExideInd1!
Manual trend and 200 EMA are bullish so the strategy stands at buy on dips.
Expect a strong breakout if the resisting trendline is breached because the resistance at 186.40 was broken and the bullish candle is a strong one.
Multiple supports at 176.80 & 166.05 (manual) and 162.25 (200 EMA).
Wait for a dip or wait for a breakout to trade.
Daily chart of ExideInd1!
Manual trend and 200 EMA are bullish so the strategy stands at buy on dips.
Expect a strong breakout if the resisting trendline is breached because the resistance at 186.40 was broken and the bullish candle is a strong one.
Multiple supports at 176.80 & 166.05 (manual) and 162.25 (200 EMA).
Wait for a dip or wait for a breakout to trade.

免責事項
これらの情報および投稿は、TradingViewが提供または承認する金融、投資、取引、またはその他の種類の助言もしくは推奨であることを意図したものではなく、またこれらに該当するものでもありません。詳細は利用規約をご覧ください。
免責事項
これらの情報および投稿は、TradingViewが提供または承認する金融、投資、取引、またはその他の種類の助言もしくは推奨であることを意図したものではなく、またこれらに該当するものでもありません。詳細は利用規約をご覧ください。