ロング
Facebook (FB)
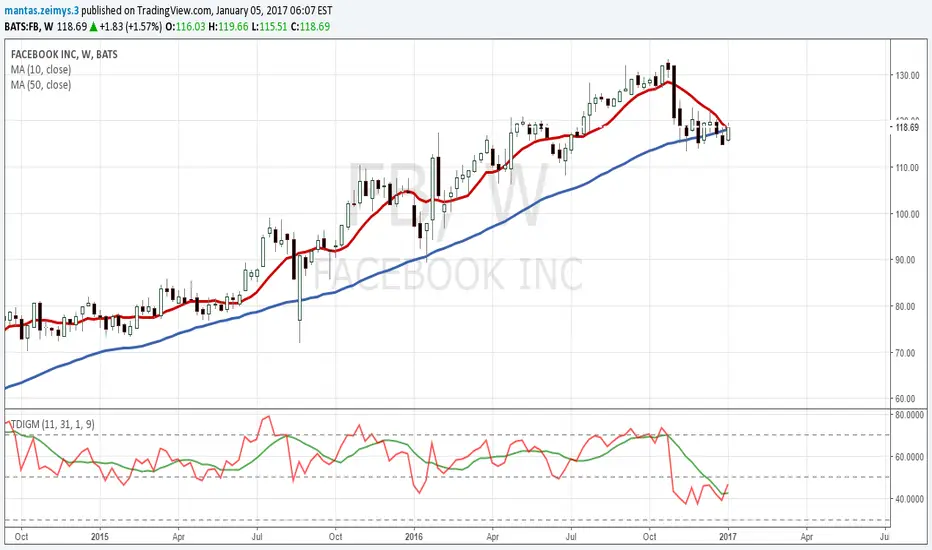
Timeframe: W1
Indicator:
10SMA - Entry point
50SMA - Check trend (If price under 50SMA(Bearish trend) , if above 50SMA(Bullish trend and we looking for buy)
TRADER DINAMIC INDEX (Green/Red) - Check entry/exit point as well
In a chart price is above 50SMA, so we looking for buy signals
TRADER DINAMIC INDEX red line cross green line from bottom.
When price cross 10SMA we need to buy. STOP LOSS 3% / TAKE PROFIT 10%
If price no touch take profit and TRADER DINAMIC INDEX cross from above need close position with profit or loss.
Indicator:
10SMA - Entry point
50SMA - Check trend (If price under 50SMA(Bearish trend) , if above 50SMA(Bullish trend and we looking for buy)
TRADER DINAMIC INDEX (Green/Red) - Check entry/exit point as well
In a chart price is above 50SMA, so we looking for buy signals
TRADER DINAMIC INDEX red line cross green line from bottom.
When price cross 10SMA we need to buy. STOP LOSS 3% / TAKE PROFIT 10%
If price no touch take profit and TRADER DINAMIC INDEX cross from above need close position with profit or loss.

免責事項
これらの情報および投稿は、TradingViewが提供または承認する金融、投資、取引、またはその他の種類の助言もしくは推奨であることを意図したものではなく、またこれらに該当するものでもありません。詳細は利用規約をご覧ください。
免責事項
これらの情報および投稿は、TradingViewが提供または承認する金融、投資、取引、またはその他の種類の助言もしくは推奨であることを意図したものではなく、またこれらに該当するものでもありません。詳細は利用規約をご覧ください。