ショート
Even more bad indicators for FB
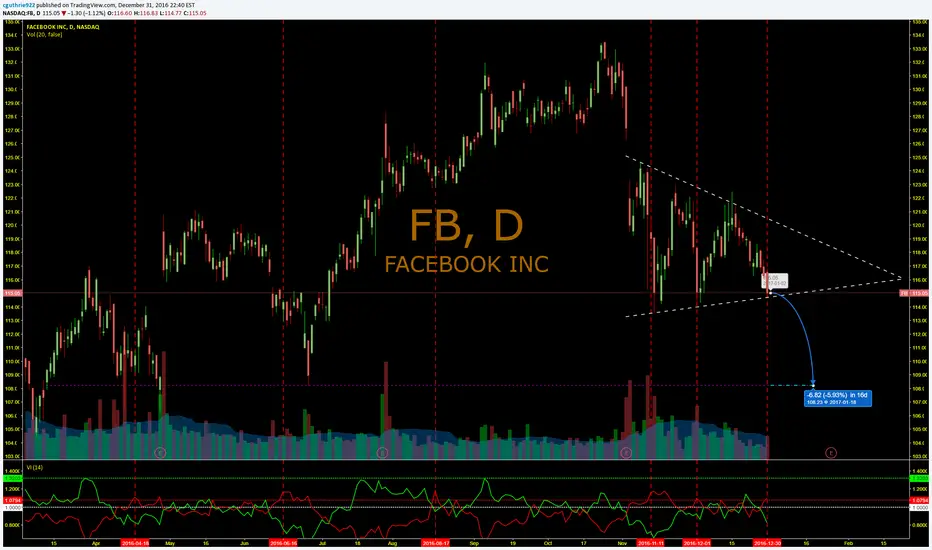
Historically when FB reaches this vortex negative level, the stock drops an average of 6.71%. FB is currently in a bearish pennant and due to break out up or down. Based on historics, the pennant, and potential support levels, it looks like a drop to 108.23 is highly likely over the next few weeks.
I am slightly skeptical of the pennant break within the next few trading days, but those believing Trump will reduce capital gains tax rates may conduct massive profit taking for calendar year 2017 while there is profit to be had in order to reap the reward come tax time in Spring of 2018. Large amounts of profit taking can become the catalyst for a near term drop in markets, or a correction which could lead to a greater than 6% drop.
I am slightly skeptical of the pennant break within the next few trading days, but those believing Trump will reduce capital gains tax rates may conduct massive profit taking for calendar year 2017 while there is profit to be had in order to reap the reward come tax time in Spring of 2018. Large amounts of profit taking can become the catalyst for a near term drop in markets, or a correction which could lead to a greater than 6% drop.

All forecasts are based on analysis of past behavior. Prior movements are not always indicative of future movement. Develop the theory, test the theory. Do your own research. Nothing in this analysis constitutes advice. YouTube For More. Good luck!!
関連の投稿
免責事項
これらの情報および投稿は、TradingViewが提供または承認する金融、投資、取引、またはその他の種類の助言もしくは推奨であることを意図したものではなく、またこれらに該当するものでもありません。詳細は利用規約をご覧ください。
All forecasts are based on analysis of past behavior. Prior movements are not always indicative of future movement. Develop the theory, test the theory. Do your own research. Nothing in this analysis constitutes advice. YouTube For More. Good luck!!
関連の投稿
免責事項
これらの情報および投稿は、TradingViewが提供または承認する金融、投資、取引、またはその他の種類の助言もしくは推奨であることを意図したものではなく、またこれらに該当するものでもありません。詳細は利用規約をご覧ください。