
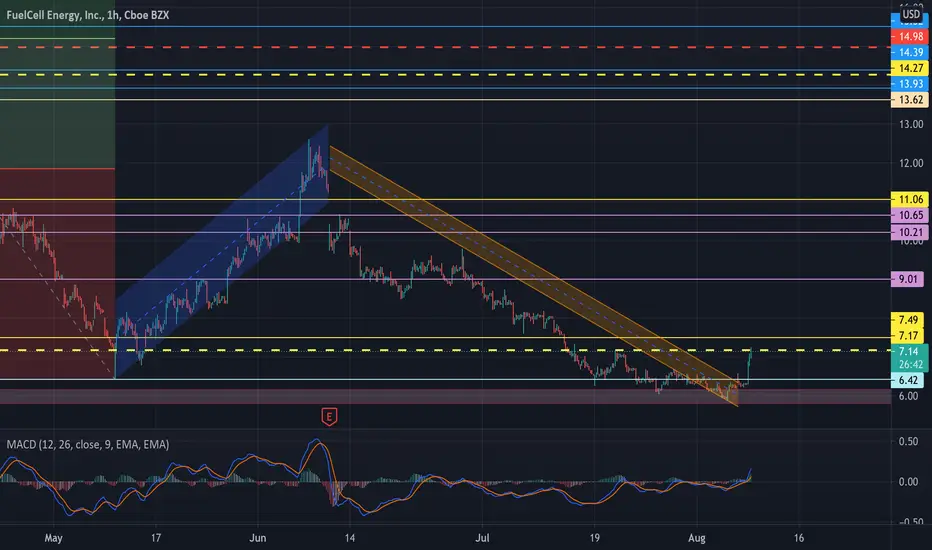
Disclaimer this may be wrong and I'm still learning like the rest; however, I've been holding since January and watched it go from 14 to 28 then all the way down to 6. So, to prevent bias in this information this is all a TA analysis thus each bar line above the current price represents old supports aka new resistance levels. Granted there will be some taking profit from swings so at the EOD we should sit at closer supports.

関連の投稿
免責事項
これらの情報および投稿は、TradingViewが提供または承認する金融、投資、取引、またはその他の種類の助言もしくは推奨であることを意図したものではなく、またこれらに該当するものでもありません。詳細は利用規約をご覧ください。
免責事項
これらの情報および投稿は、TradingViewが提供または承認する金融、投資、取引、またはその他の種類の助言もしくは推奨であることを意図したものではなく、またこれらに該当するものでもありません。詳細は利用規約をご覧ください。