FCT
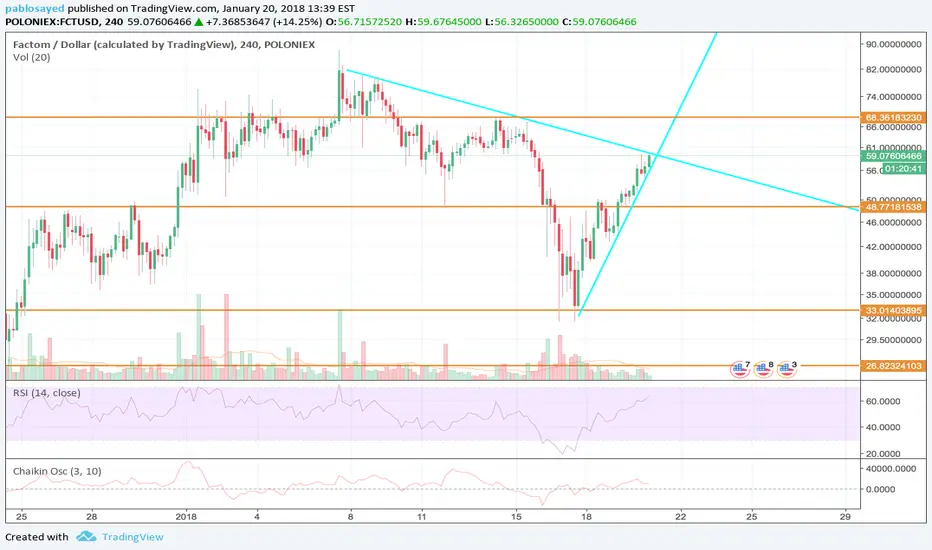
Been seeing a lot of posts lately about this coin so thought I'd put together a quick chart. The upwards trending blue line is unsustainable in my opinion so I think we will break down soon. I expect this line to flatten out quite a bit; remember i use the blue trend lines to indicate trends that will pivot. The orange lines are your resistance/support lines. The more times you see the coin bounce of of the resistance/support line the stronger it becomes. If it is acting as support and the coin drops below, then is becomes a resistance line. The more volume on each touch, the more decisive the test of the resistance line is. This chart is against USD so I'll try to put one together against btc since most seem to trade this pair.

免責事項
これらの情報および投稿は、TradingViewが提供または承認する金融、投資、取引、またはその他の種類の助言もしくは推奨であることを意図したものではなく、またこれらに該当するものでもありません。詳細は利用規約をご覧ください。
免責事項
これらの情報および投稿は、TradingViewが提供または承認する金融、投資、取引、またはその他の種類の助言もしくは推奨であることを意図したものではなく、またこれらに該当するものでもありません。詳細は利用規約をご覧ください。