
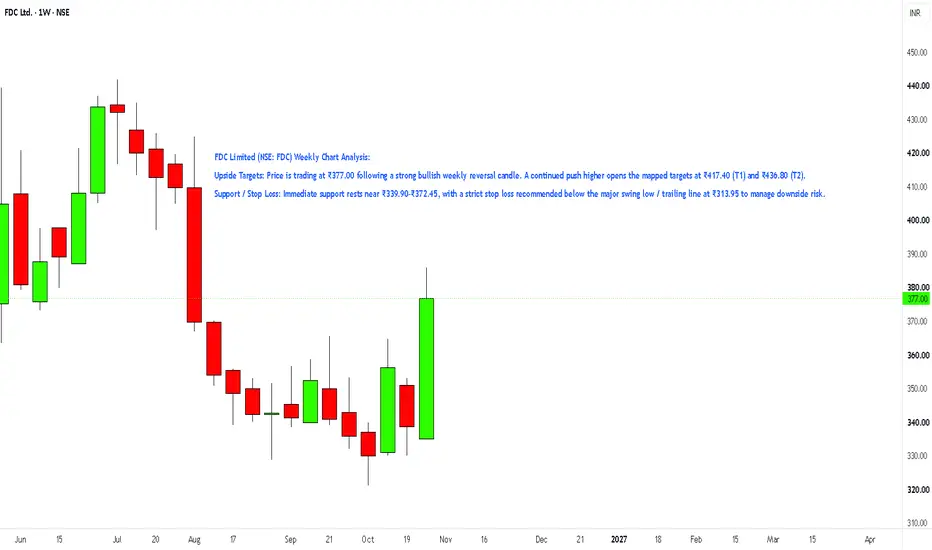
FDC Limited (NSE: FDC) Weekly Chart Analysis:
Upside Targets: Price is trading at ₹377.00 following a strong bullish weekly reversal candle. A continued push higher opens the mapped targets at ₹417.40 (T1) and ₹436.80 (T2).
Support / Stop Loss: Immediate support rests near ₹339.90–₹372.45, with a strict stop loss recommended below the major swing low / trailing line at ₹313.95 to manage downside risk.
Upside Targets: Price is trading at ₹377.00 following a strong bullish weekly reversal candle. A continued push higher opens the mapped targets at ₹417.40 (T1) and ₹436.80 (T2).
Support / Stop Loss: Immediate support rests near ₹339.90–₹372.45, with a strict stop loss recommended below the major swing low / trailing line at ₹313.95 to manage downside risk.

Automated Tools/Indicators/Screeners available at kkonline.org/nimblrta
免責事項
これらの情報および投稿は、TradingViewが提供または承認する金融、投資、取引、またはその他の種類の助言もしくは推奨であることを意図したものではなく、またこれらに該当するものでもありません。詳細は利用規約をご覧ください。
Automated Tools/Indicators/Screeners available at kkonline.org/nimblrta
免責事項
これらの情報および投稿は、TradingViewが提供または承認する金融、投資、取引、またはその他の種類の助言もしくは推奨であることを意図したものではなく、またこれらに該当するものでもありません。詳細は利用規約をご覧ください。