
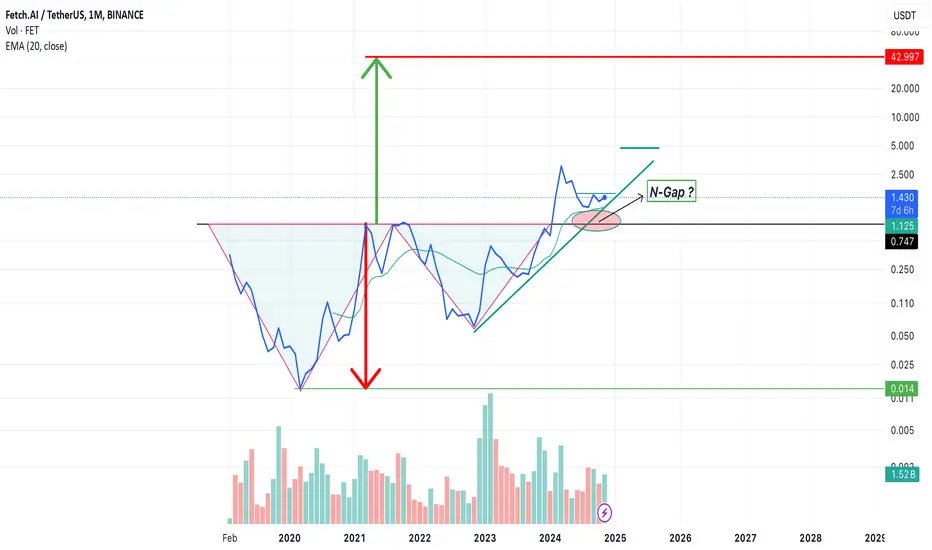
🚀 Double Bottom Pattern with Strong Buyers! 🔥
When the second bottom forms higher than the first, it signals that buyers are gaining control, and selling pressure is weakening. 💪
After breaking the resistance, the price target is calculated based on the height of the pattern from the resistance level.
📊 My Analysis:
Resistance: $0.74
First Bottom: 0.014
Potential Target: $42
Everything is Possible in a Mega Bull-run , Get ready for a strong bullish move! 📈✨
Always DYOR !
When the second bottom forms higher than the first, it signals that buyers are gaining control, and selling pressure is weakening. 💪
After breaking the resistance, the price target is calculated based on the height of the pattern from the resistance level.
📊 My Analysis:
Resistance: $0.74
First Bottom: 0.014
Potential Target: $42
Everything is Possible in a Mega Bull-run , Get ready for a strong bullish move! 📈✨
Always DYOR !

関連の投稿
免責事項
これらの情報および投稿は、TradingViewが提供または承認する金融、投資、取引、またはその他の種類の助言もしくは推奨であることを意図したものではなく、またこれらに該当するものでもありません。詳細は利用規約をご覧ください。
免責事項
これらの情報および投稿は、TradingViewが提供または承認する金融、投資、取引、またはその他の種類の助言もしくは推奨であることを意図したものではなく、またこれらに該当するものでもありません。詳細は利用規約をご覧ください。