
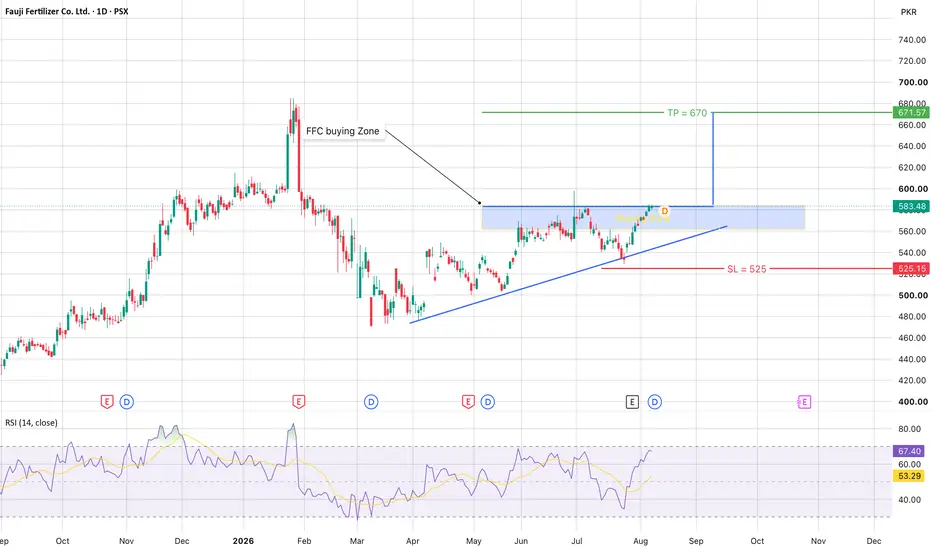
FFC Technical Analysis – Ascending Triangle Formation
Disclaimer: This analysis is for educational purposes only and should not be considered financial advice. Always use proper risk management before taking any trade.
FFC is currently forming an Ascending Triangle, a bullish continuation pattern characterized by a series of higher lows developing beneath a relatively strong horizontal resistance.
The pattern suggests that a breakout above the resistance could trigger the next bullish leg. Until the breakout occurs, the stock may continue consolidating within the triangle.
Entry / Accumulation Zone: 585 – 560
The 560–585 range is the preferred accumulation zone. Traders can also consider accumulating around the current market price if the price continues to respect the ascending-triangle structure.
Stop Loss (SL): 525
A sustained move below 525 would weaken the current bullish structure and invalidate the setup.
Target (TP): 670
A successful breakout from the ascending triangle could open the way toward the 670 target.
Estimated Risk & Reward
Using the midpoint of the accumulation zone at 572.50:
• Approximate Risk to SL: 8.30%
• Potential Gain to TP 670: 17.03%
• Approximate Risk-to-Reward: 1:2.05
Using the upper accumulation level of 585:
• Risk to SL: 10.26%
• Potential Gain to TP: 14.53%
Trading Plan
• Accumulate within the 560–585 zone while the bullish structure remains intact.
• Current levels can also be considered for gradual accumulation if price continues to respect support.
• Maintain the stop loss at 525.
• Monitor the upper resistance of the ascending triangle for a potential breakout.
• A confirmed breakout with strong volume would strengthen the bullish setup toward 670.
The key factor is patience. Allow the ascending triangle to develop and manage the position according to the defined risk level.

Technical Analyst | CMT Level I Candidate with 5+ years of investing and 3+ years of trading experience across equity and forex markets. Focused on price action, market structure, disciplined risk management to deliver clear, educational market insights.
免責事項
これらの情報および投稿は、TradingViewが提供または承認する金融、投資、取引、またはその他の種類の助言もしくは推奨であることを意図したものではなく、またこれらに該当するものでもありません。詳細は利用規約をご覧ください。