
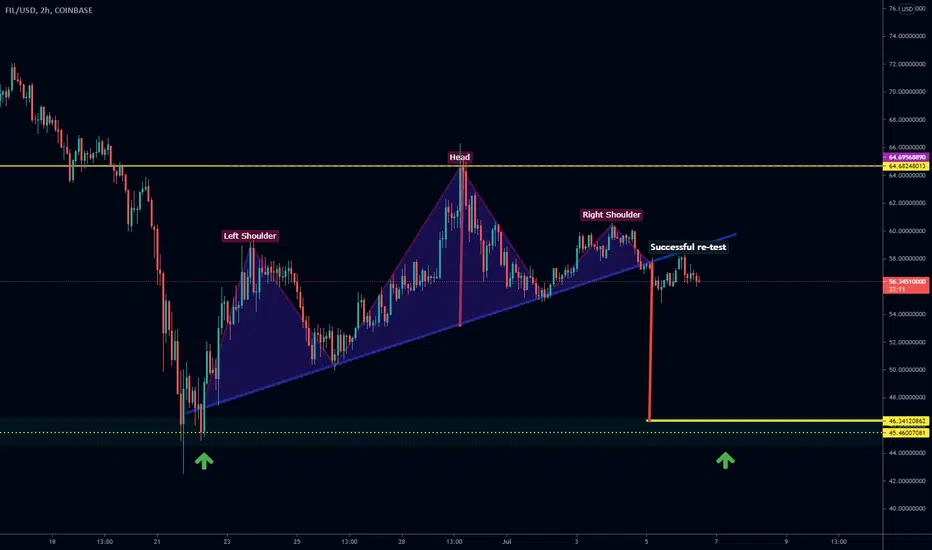
2H chart just confirmed a head and shoulders pattern. I've been expecting a strong rally following its 80% correction over the last few months. We've broken out of downtrends on both pairings, BTC and USD. We recently experienced a death cross on the 50/200 daily EMA and MA. The last time this occurred we saw a brief drop in price, followed by the strongest rally filecoin has had to date. I think it's about to happen again.
First, double bottom while re-testing the top of the trendline we broke out of, then rally. This chart is for the double bottom prediction alone, see related ideas in the links below.
First, double bottom while re-testing the top of the trendline we broke out of, then rally. This chart is for the double bottom prediction alone, see related ideas in the links below.
ノート
long-term bullish chart below: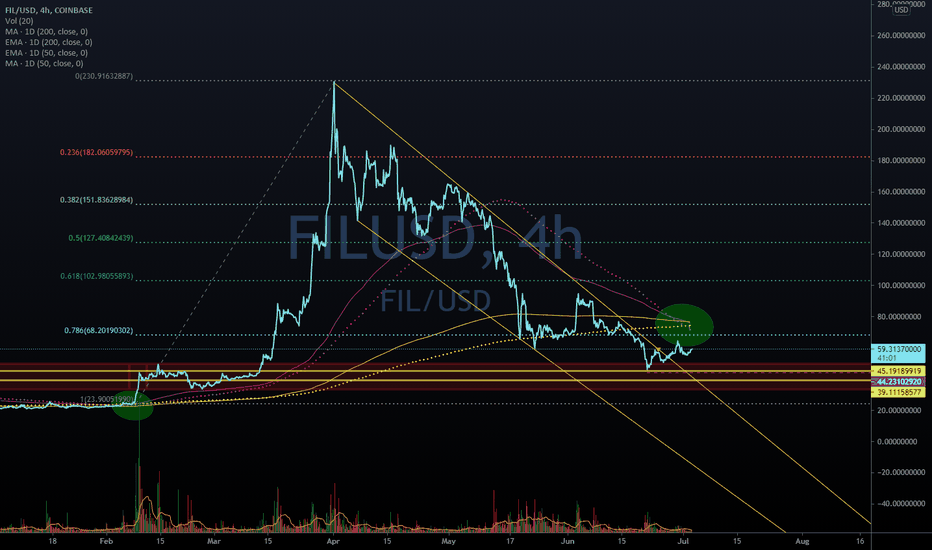
ノート
Approaching target area of 45-46 dollars, may reach it this week - today is even possible.
関連の投稿
免責事項
これらの情報および投稿は、TradingViewが提供または承認する金融、投資、取引、またはその他の種類の助言もしくは推奨であることを意図したものではなく、またこれらに該当するものでもありません。詳細は利用規約をご覧ください。
関連の投稿
免責事項
これらの情報および投稿は、TradingViewが提供または承認する金融、投資、取引、またはその他の種類の助言もしくは推奨であることを意図したものではなく、またこれらに該当するものでもありません。詳細は利用規約をご覧ください。