ロング
FIOUSDT Long-Term View:
Hey there, crypto traders!
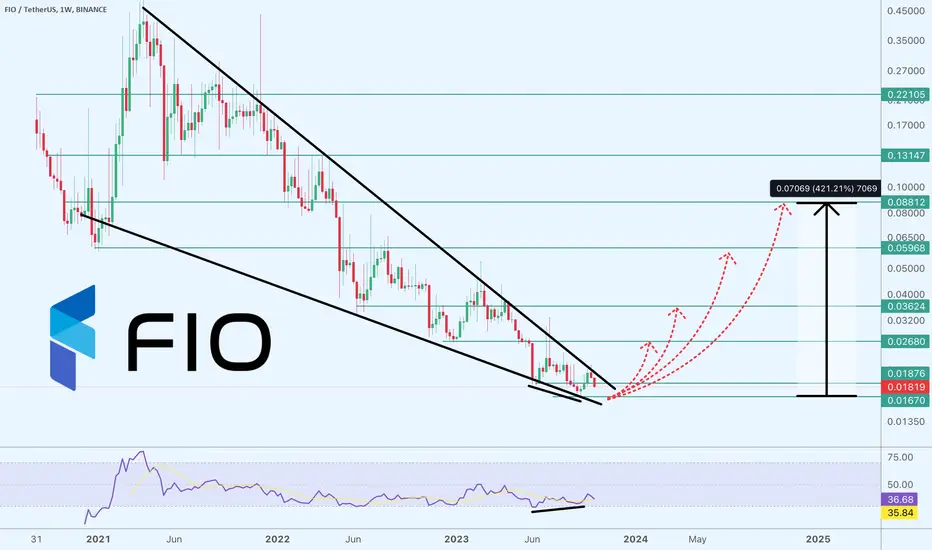
Today let's discover the chart of $BINANCE:FIOUSDT consolidated in the Falling Wedge pattern.
This chart formation suggests a substantial move, potentially revisiting previous support-resistance levels.
Waiting for a confirmed breakout is crucial, guarding against premature moves that might lead to new All-Time Lows.
🎯 Key Resistance Levels:
0.019 - 0.026 - 0.036 - 0.059 - 0.088
Patience is key!
If you like my graphics, send some 💙💛
Today let's discover the chart of $BINANCE:FIOUSDT consolidated in the Falling Wedge pattern.
This chart formation suggests a substantial move, potentially revisiting previous support-resistance levels.
Waiting for a confirmed breakout is crucial, guarding against premature moves that might lead to new All-Time Lows.
🎯 Key Resistance Levels:
0.019 - 0.026 - 0.036 - 0.059 - 0.088
Patience is key!
ノート
After pressing Play button I think there is a breakout in the processトレード稼働中
トレード稼働中
Despite the publication date, this targets still work.
免責事項
これらの情報および投稿は、TradingViewが提供または承認する金融、投資、取引、またはその他の種類の助言もしくは推奨であることを意図したものではなく、またこれらに該当するものでもありません。詳細は利用規約をご覧ください。
免責事項
これらの情報および投稿は、TradingViewが提供または承認する金融、投資、取引、またはその他の種類の助言もしくは推奨であることを意図したものではなく、またこれらに該当するものでもありません。詳細は利用規約をご覧ください。