
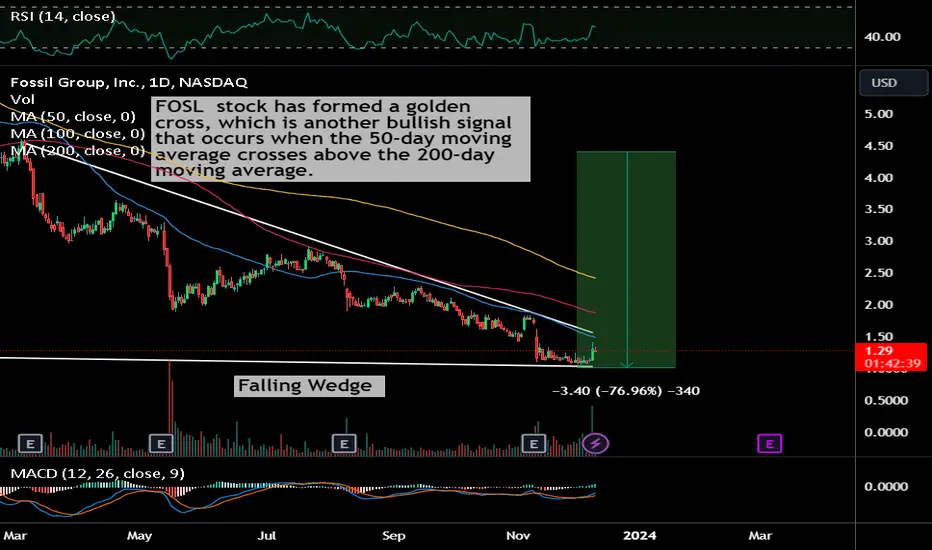
FOSL has been in a downtrend since June 2021, when it reached a 52-week high of $6.08. The stock has formed a descending wedge pattern, which is a bullish reversal pattern that indicates a possible breakout to the upside.
The stock has recently crossed above the resistance line of the wedge, which is a positive sign of a trend change. The stock has also formed a golden cross, which is another bullish signal that occurs when the 50-day moving average crosses above the 200-day moving average. The stock is now trading above both the moving averages, which are acting as support levels.
The stock has recently crossed above the resistance line of the wedge, which is a positive sign of a trend change. The stock has also formed a golden cross, which is another bullish signal that occurs when the 50-day moving average crosses above the 200-day moving average. The stock is now trading above both the moving averages, which are acting as support levels.

免責事項
これらの情報および投稿は、TradingViewが提供または承認する金融、投資、取引、またはその他の種類の助言もしくは推奨であることを意図したものではなく、またこれらに該当するものでもありません。詳細は利用規約をご覧ください。
免責事項
これらの情報および投稿は、TradingViewが提供または承認する金融、投資、取引、またはその他の種類の助言もしくは推奨であることを意図したものではなく、またこれらに該当するものでもありません。詳細は利用規約をご覧ください。