ロング
Frontier (FRONT)
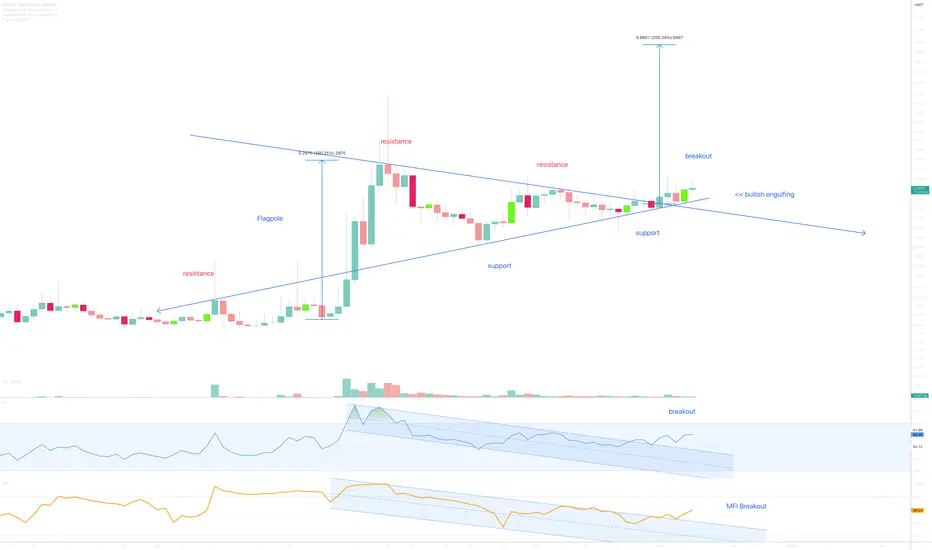
On the above 2-day chart price action has corrected over 60% since the 200% move in September (idea attached). A number of reasons now exist to consider a long position. They include:
1) Price action and RSI resistance breakouts.
2) Price action backtest on past resistance confirms support.
3) Volume. Money Flow resistance breakout. I don’t know why, but more money is flowing in than out.
4) The pennant formation, a reliable chart pattern on confirmation. Price action forecast is determined from taking the flagpole extension to the breakpoint.
Is it possible price action falls further? Sure.
Is it probable? No
Type: Trade
Risk: <=6%
Timeframe for long: Don’t know.
Return: 200%
1) Price action and RSI resistance breakouts.
2) Price action backtest on past resistance confirms support.
3) Volume. Money Flow resistance breakout. I don’t know why, but more money is flowing in than out.
4) The pennant formation, a reliable chart pattern on confirmation. Price action forecast is determined from taking the flagpole extension to the breakpoint.
Is it possible price action falls further? Sure.
Is it probable? No
Type: Trade
Risk: <=6%
Timeframe for long: Don’t know.
Return: 200%
トレード稼働中
Train is departing from Platform $$トレード稼働中
Who FOMO'd in at 50 cents to eat a 30% correction? Whomever it was, I'm guessing a long position is the last thing on their minds right now.10hr - almost too easy.
ノート
Think a large move is about to print. Can't say exactly why, just a hunch.Must ask below for updates, not trading this.
Ww
ノート
Large move confirmed as per last update.Anyone know how it was forecast?
トレード稼働中
ノート
700%ノート
150% since the long signal in mid-April 
関連の投稿
免責事項
これらの情報および投稿は、TradingViewが提供または承認する金融、投資、取引、またはその他の種類の助言もしくは推奨であることを意図したものではなく、またこれらに該当するものでもありません。詳細は利用規約をご覧ください。
免責事項
これらの情報および投稿は、TradingViewが提供または承認する金融、投資、取引、またはその他の種類の助言もしくは推奨であることを意図したものではなく、またこれらに該当するものでもありません。詳細は利用規約をご覧ください。