
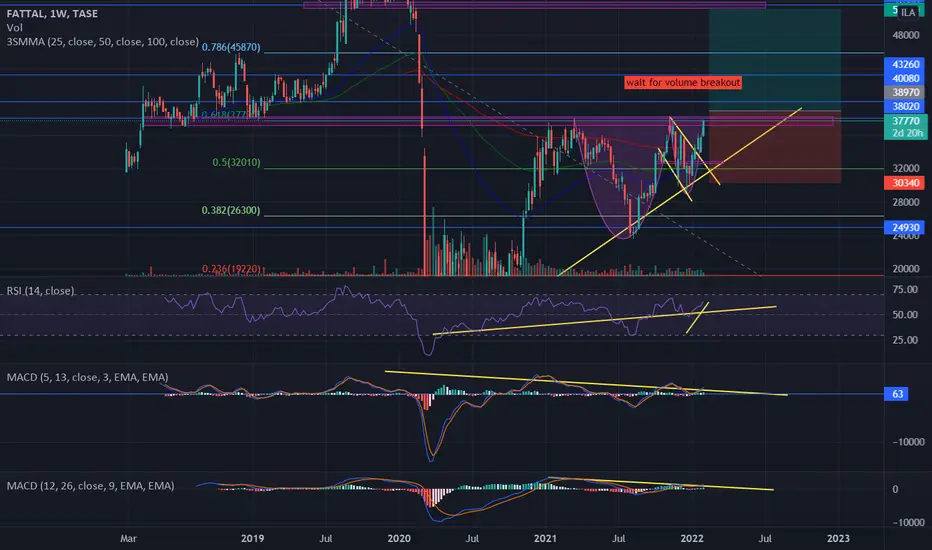
Perfect cup and handle.
waiting for the resistance and the 0.618 fib to break, and the weekly + monthly candlsticks close above resistance.
50 ema in monthly chart will break now, after few rejects.
In weekly chart all ema failed to reject.
I estimate 30% growth to the next month:)
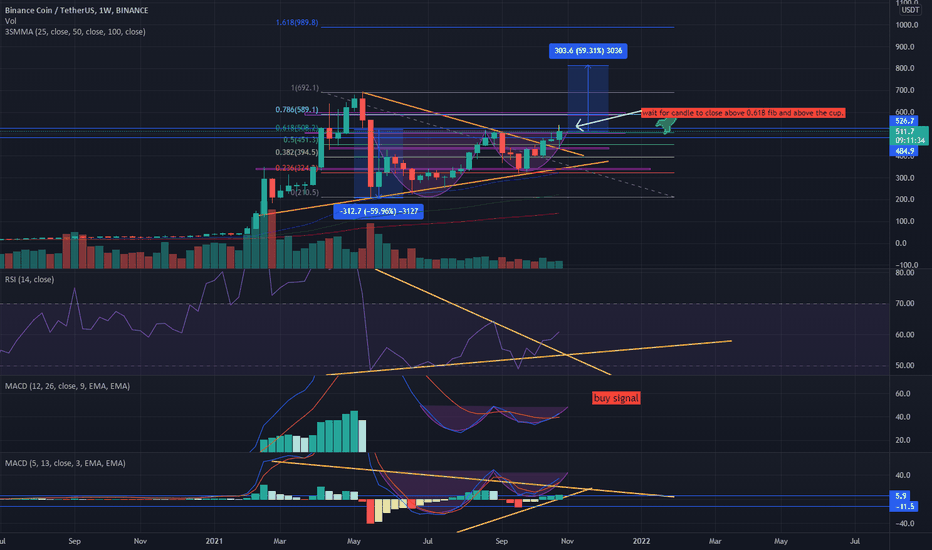
In the past I TA very similar BNBUSDT weekly chart and the growth wasn't late to come.
The chart:
FTAL monthly chart:

waiting for the resistance and the 0.618 fib to break, and the weekly + monthly candlsticks close above resistance.
50 ema in monthly chart will break now, after few rejects.
In weekly chart all ema failed to reject.
I estimate 30% growth to the next month:)
In the past I TA very similar BNBUSDT weekly chart and the growth wasn't late to come.
The chart:
FTAL monthly chart:

関連の投稿
免責事項
これらの情報および投稿は、TradingViewが提供または承認する金融、投資、取引、またはその他の種類の助言もしくは推奨であることを意図したものではなく、またこれらに該当するものでもありません。詳細は利用規約をご覧ください。
免責事項
これらの情報および投稿は、TradingViewが提供または承認する金融、投資、取引、またはその他の種類の助言もしくは推奨であることを意図したものではなく、またこれらに該当するものでもありません。詳細は利用規約をご覧ください。