
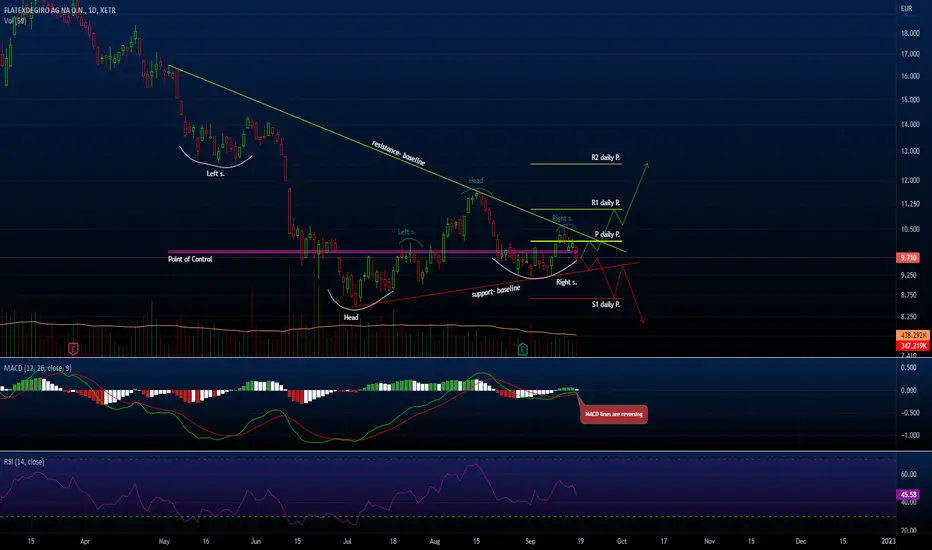
The daily chart shows two "head and shoulders" patterns.
They both tell different stories because they point in opposite directions.
The larger one (inverted) is bullish, while the smaller one, which is also slightly hidden, is bearish.
Whatever the case, the price is getting squeezed into a smaller space, so the breakout will be powerful.
Resistance: 10.165, 11.095, 12.57
Support: 9.41, 8.675
They both tell different stories because they point in opposite directions.
The larger one (inverted) is bullish, while the smaller one, which is also slightly hidden, is bearish.
Whatever the case, the price is getting squeezed into a smaller space, so the breakout will be powerful.
Resistance: 10.165, 11.095, 12.57
Support: 9.41, 8.675

関連の投稿
免責事項
これらの情報および投稿は、TradingViewが提供または承認する金融、投資、取引、またはその他の種類の助言もしくは推奨であることを意図したものではなく、またこれらに該当するものでもありません。詳細は利用規約をご覧ください。
関連の投稿
免責事項
これらの情報および投稿は、TradingViewが提供または承認する金融、投資、取引、またはその他の種類の助言もしくは推奨であることを意図したものではなく、またこれらに該当するものでもありません。詳細は利用規約をご覧ください。