ロング
FunFair - Looking to Break Out
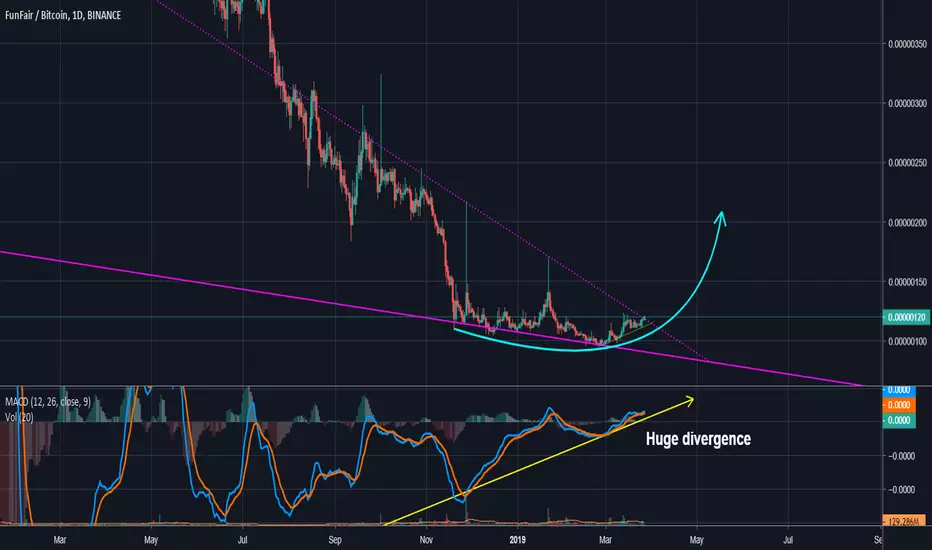
Looking at FunFair's daily chart , the price is testing the upper boundary of a falling wedge , which is a bullish pattern . Huge divergence can be seen on the MACD and it has crossed the zero line. If Fun can break the overhead resistance, it could have a strong bull run of its own after a 14 month bear market.

免責事項
これらの情報および投稿は、TradingViewが提供または承認する金融、投資、取引、またはその他の種類の助言もしくは推奨であることを意図したものではなく、またこれらに該当するものでもありません。詳細は利用規約をご覧ください。
免責事項
これらの情報および投稿は、TradingViewが提供または承認する金融、投資、取引、またはその他の種類の助言もしくは推奨であることを意図したものではなく、またこれらに該当するものでもありません。詳細は利用規約をご覧ください。