
Hello TradingView friends and legends 👋📊
Hope you're all crushing the markets and staying profitable 💚📈
🏢 **About the Company**
Futu Holdings Limited is a leading fintech company providing digital brokerage and wealth management services, mainly across Hong Kong and China. With the growth of retail trading and tech-driven finance, this stock has been gaining strong attention from institutional and retail investors alike 🌐💼
📊 **Technical Analysis (Daily Timeframe)**
Looking at the chart structure:
📈 The overall **daily trend is bullish** — higher lows and recovery momentum confirm buyers are still in control.
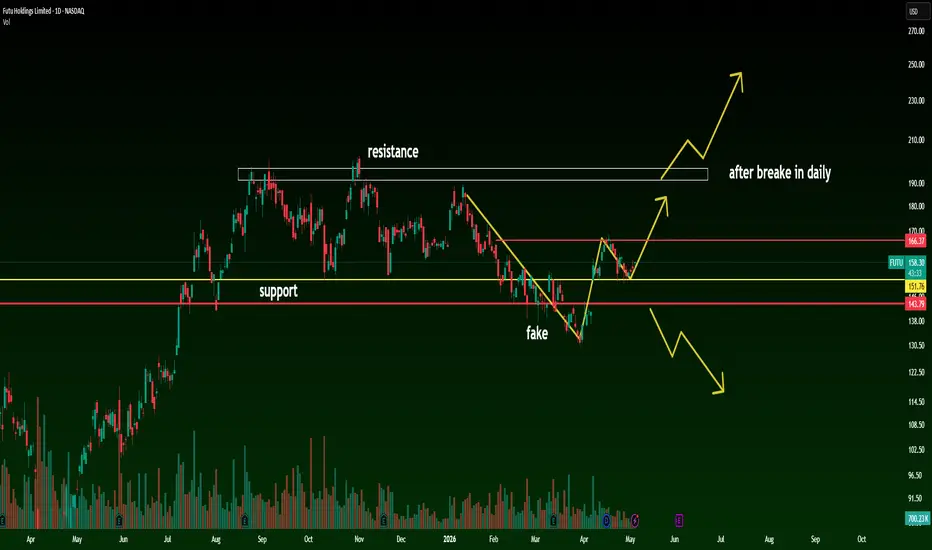
📦 After reaching a key **resistance zone**, price has formed a **daily range (box consolidation)** — indicating accumulation and indecision before the next move ⏳
⚠️ Price made a **fake breakdown below the box** (bear trap) — trapping sellers and quickly reclaiming the range. This is often a strong bullish signal 💥🐂
🔄 Currently, price is moving back inside the range and has the potential to:
➡️ Move toward the **top of the range (range high)** 📊
➡️ If breakout happens above the box → continuation toward higher targets 🚀🔥
📌 **Key Scenarios**
🔹 Bullish: Hold above support → push to range high → breakout → strong rally 🚀
🔹 Neutral: Continue ranging inside the box ⏳
🔹 Bearish: Lose support again → deeper correction 📉
📊 **What do you think? (Poll)**
🔘 Breakout and continuation 🚀
🔘 Range movement continues ⏳
🔘 Fake move and drop 📉
🛑 **Disclaimer**
This is not financial advice. This analysis is based on personal opinion and market structure. Always do your own research and manage your risk before entering any trade ⚠️
#FUTU #Stocks #TechnicalAnalysis #PriceAction #TradingView #Breakout #Bullish #NASDAQ #SmartMoney
Hope you're all crushing the markets and staying profitable 💚📈
🏢 **About the Company**
Futu Holdings Limited is a leading fintech company providing digital brokerage and wealth management services, mainly across Hong Kong and China. With the growth of retail trading and tech-driven finance, this stock has been gaining strong attention from institutional and retail investors alike 🌐💼
📊 **Technical Analysis (Daily Timeframe)**
Looking at the chart structure:
📈 The overall **daily trend is bullish** — higher lows and recovery momentum confirm buyers are still in control.
📦 After reaching a key **resistance zone**, price has formed a **daily range (box consolidation)** — indicating accumulation and indecision before the next move ⏳
⚠️ Price made a **fake breakdown below the box** (bear trap) — trapping sellers and quickly reclaiming the range. This is often a strong bullish signal 💥🐂
🔄 Currently, price is moving back inside the range and has the potential to:
➡️ Move toward the **top of the range (range high)** 📊
➡️ If breakout happens above the box → continuation toward higher targets 🚀🔥
📌 **Key Scenarios**
🔹 Bullish: Hold above support → push to range high → breakout → strong rally 🚀
🔹 Neutral: Continue ranging inside the box ⏳
🔹 Bearish: Lose support again → deeper correction 📉
📊 **What do you think? (Poll)**
🔘 Breakout and continuation 🚀
🔘 Range movement continues ⏳
🔘 Fake move and drop 📉
🛑 **Disclaimer**
This is not financial advice. This analysis is based on personal opinion and market structure. Always do your own research and manage your risk before entering any trade ⚠️
#FUTU #Stocks #TechnicalAnalysis #PriceAction #TradingView #Breakout #Bullish #NASDAQ #SmartMoney

免責事項
これらの情報および投稿は、TradingViewが提供または承認する金融、投資、取引、またはその他の種類の助言もしくは推奨であることを意図したものではなく、またこれらに該当するものでもありません。詳細は利用規約をご覧ください。
免責事項
これらの情報および投稿は、TradingViewが提供または承認する金融、投資、取引、またはその他の種類の助言もしくは推奨であることを意図したものではなく、またこれらに該当するものでもありません。詳細は利用規約をご覧ください。