
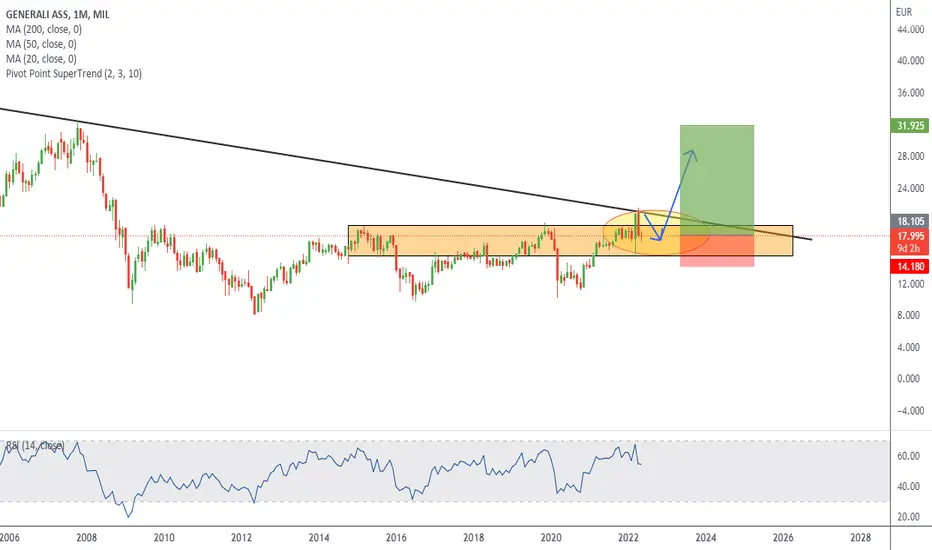
For having a better understading of what is happening on this stock about my last idea, on the Montly chart we see a clear break of structure and a retest of it after testing an important trendline(formed in Oct 07).The price has been bouncing over the last 12 years and now finally we see a strong candle formed in March this year breaking all structure and showing us bullish pressure. We can expect more bullish continuation the next months if price manage to break this trendline. Important monitoring price action in lower timeframes.

免責事項
これらの情報および投稿は、TradingViewが提供または承認する金融、投資、取引、またはその他の種類の助言もしくは推奨であることを意図したものではなく、またこれらに該当するものでもありません。詳細は利用規約をご覧ください。
免責事項
これらの情報および投稿は、TradingViewが提供または承認する金融、投資、取引、またはその他の種類の助言もしくは推奨であることを意図したものではなく、またこれらに該当するものでもありません。詳細は利用規約をご覧ください。