
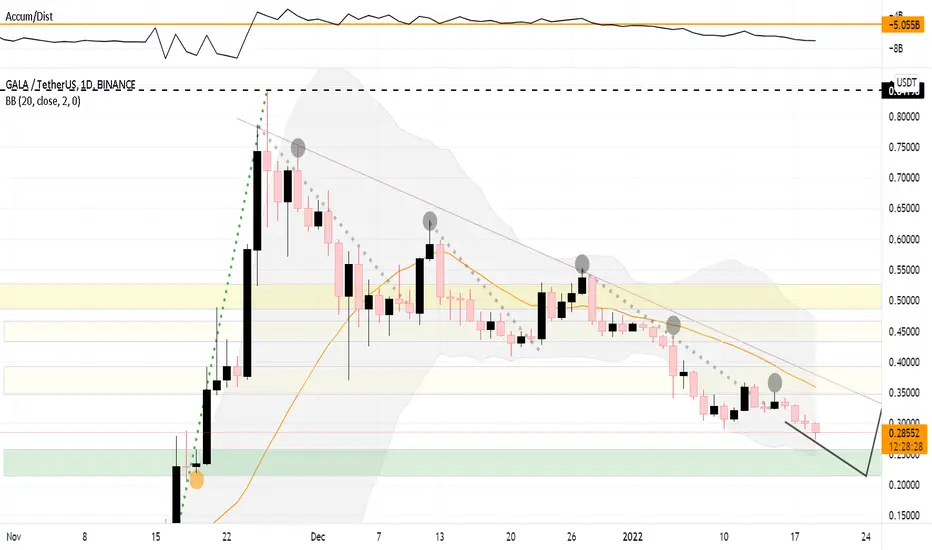
The green zone highlighted should be the ideal Buy range - IMO.
The chart looks pretty typical.
It might get further down by 5 to 10% to reach the Major Bullish range., where the volume needs to pick up
above the Orange Line.
The Trend line looks to be the major resistance for the structure to break out.
The chart turns bullish either :
1. Volume picks up accumulating in Green Zone.
2. Breaks Resistance zones shown in Yellow.
The Chart turns further bearish either :
1. Breaks further down the Green Buy Zone
2. Further drops in Volume.
Not a financial advice
DYOR.
Happy trading

免責事項
これらの情報および投稿は、TradingViewが提供または承認する金融、投資、取引、またはその他の種類の助言もしくは推奨であることを意図したものではなく、またこれらに該当するものでもありません。詳細は利用規約をご覧ください。
免責事項
これらの情報および投稿は、TradingViewが提供または承認する金融、投資、取引、またはその他の種類の助言もしくは推奨であることを意図したものではなく、またこれらに該当するものでもありません。詳細は利用規約をご覧ください。