
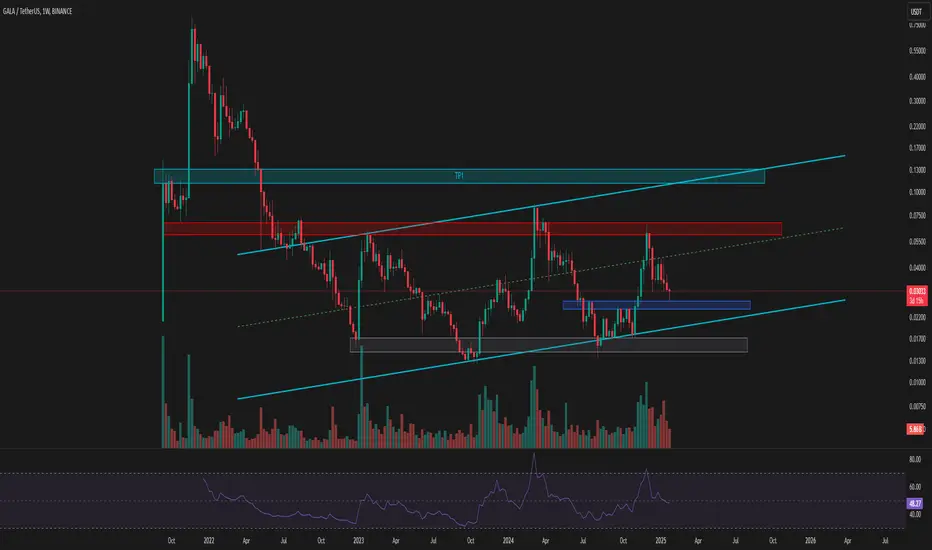
Comprehensive Analysis of GALA
🔹 Project Introduction:
GALA is a blockchain-based ecosystem focused on developing decentralized gaming (GameFi) and NFTs. The project aims to give players full control over their in-game assets while introducing a new economic model for the gaming industry.
📊 Technical Analysis of GALA/USDT
🔍 Overall Market Condition:
GALA is currently trading within a mid-term ascending channel and is sitting at a key support zone that will determine the next major price direction.
🟢 Bullish Scenario:
Key Support Zone:
$0.02435 – $0.02684 (Blue Box)
If this support holds, the price could move toward the midline of the ascending channel.
The next major resistance lies within the red zone:
$0.05949 – $0.06914
This resistance acts as a crucial ceiling for the price.
🚀 Potential Targets After Breaking the Red Resistance:
✅ TP1: Channel Top
✅ TP2: Breakout Above the Channel → Higher Price Levels
🔴 Bearish Scenario:
If the blue support zone fails to hold:
The price could drop to the bottom of the ascending channel + weekly support
🏁 (Gray Box)
Losing this level may trigger a new bearish trend.
📈 Trend Confirmation Factors:
✔ Increasing volume on breakouts → Confirms bullish momentum
✔ Declining volume on pullbacks → Indicates weak selling pressure
✔ RSI near 50: A move towards 70 (Overbought Zone) signals bullish strength
📌 Summary & Suggested Strategy:
🔹 Holding the blue support → Targeting the red resistance
🔹 Breaking the red resistance → Potential move towards TP1
🔹 Breakout above the channel → Strong bullish rally
🔹 Heavy rejection → Key support at the bottom of the channel (Gray Box)
⚠️Risk Management:
Monitor trading volume & RSI behavior to confirm breakouts or reversals.

免責事項
これらの情報および投稿は、TradingViewが提供または承認する金融、投資、取引、またはその他の種類の助言もしくは推奨であることを意図したものではなく、またこれらに該当するものでもありません。詳細は利用規約をご覧ください。
免責事項
これらの情報および投稿は、TradingViewが提供または承認する金融、投資、取引、またはその他の種類の助言もしくは推奨であることを意図したものではなく、またこれらに該当するものでもありません。詳細は利用規約をご覧ください。