
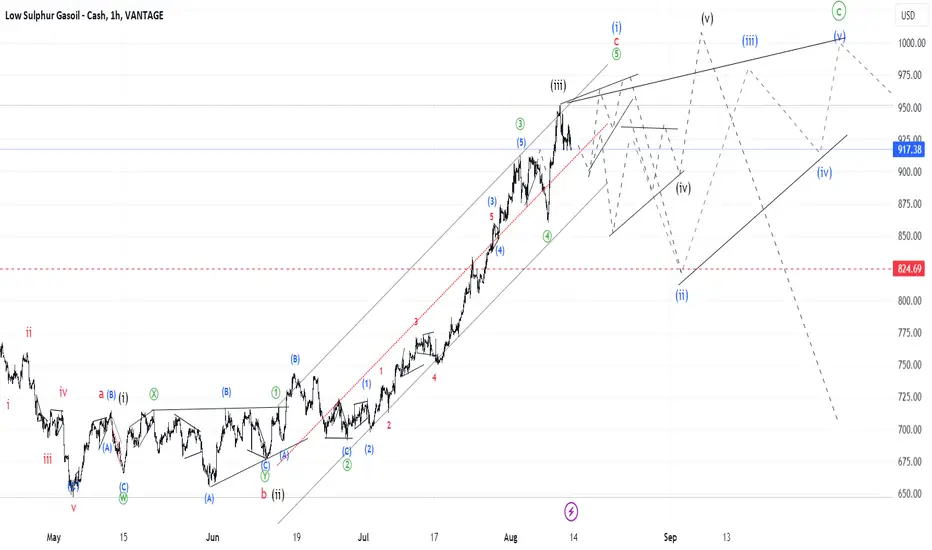
The Gasoil chart also has several alternatives to how it can shape the end of the uptrend. I indicated them on the chart below. Black labels mark the alternative scenario. Probability is not much different from each other. In summary, we have to prepare for a volatile environment which would be difficult to orientate until it is over and wave [c] of X is formed.

免責事項
これらの情報および投稿は、TradingViewが提供または承認する金融、投資、取引、またはその他の種類の助言もしくは推奨であることを意図したものではなく、またこれらに該当するものでもありません。詳細は利用規約をご覧ください。
免責事項
これらの情報および投稿は、TradingViewが提供または承認する金融、投資、取引、またはその他の種類の助言もしくは推奨であることを意図したものではなく、またこれらに該当するものでもありません。詳細は利用規約をご覧ください。