

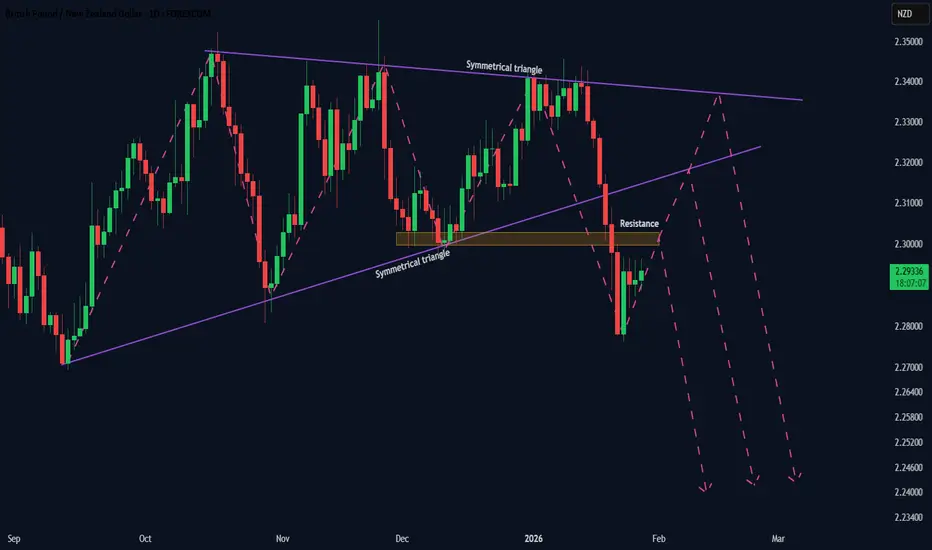
Price previously developed inside a clear symmetrical triangle on the Daily chart, representing a prolonged phase of balance between buyers and sellers.
That balance was resolved to the downside with a decisive breakdown, signaling that selling pressure has taken control.
Price is now in a pullback phase, which is a natural behavior after a strong directional expansion.
This is not a prediction — it is an observation of how market pressure interacts with structure after imbalance.
📉 Scenario Observations – Pullback Within Bearish Pressure
Possible pullback paths while bearish pressure remains dominant:
• pullback into prior resistance, then continuation lower
• pullback toward the ascending trendline, followed by rejection
• deeper pullback toward the descending triangle trendline, then continuation lower
All three scenarios reflect corrective movement within a bearish pressure environment.
⚠️ Pressure Reassessment
If price breaks and sustains above the descending trendline, bearish pressure becomes less evident and the structure requires reassessment.
🧠 Key Insight
Markets move from balance → imbalance → correction.
Pressure, not patterns, determines continuation.
⚠️ Educational & Analytical Use Only
This analysis is shared strictly for educational and analytical purposes.
No financial advice, trade signals, or guarantees are provided.
All decisions remain the sole responsibility of the reader and should align with their own ethical, legal, and religious principles.
That balance was resolved to the downside with a decisive breakdown, signaling that selling pressure has taken control.
Price is now in a pullback phase, which is a natural behavior after a strong directional expansion.
This is not a prediction — it is an observation of how market pressure interacts with structure after imbalance.
📉 Scenario Observations – Pullback Within Bearish Pressure
Possible pullback paths while bearish pressure remains dominant:
• pullback into prior resistance, then continuation lower
• pullback toward the ascending trendline, followed by rejection
• deeper pullback toward the descending triangle trendline, then continuation lower
All three scenarios reflect corrective movement within a bearish pressure environment.
⚠️ Pressure Reassessment
If price breaks and sustains above the descending trendline, bearish pressure becomes less evident and the structure requires reassessment.
🧠 Key Insight
Markets move from balance → imbalance → correction.
Pressure, not patterns, determines continuation.
⚠️ Educational & Analytical Use Only
This analysis is shared strictly for educational and analytical purposes.
No financial advice, trade signals, or guarantees are provided.
All decisions remain the sole responsibility of the reader and should align with their own ethical, legal, and religious principles.

関連の投稿
免責事項
これらの情報および投稿は、TradingViewが提供または承認する金融、投資、取引、またはその他の種類の助言もしくは推奨であることを意図したものではなく、またこれらに該当するものでもありません。詳細は利用規約をご覧ください。
関連の投稿
免責事項
これらの情報および投稿は、TradingViewが提供または承認する金融、投資、取引、またはその他の種類の助言もしくは推奨であることを意図したものではなく、またこれらに該当するものでもありません。詳細は利用規約をご覧ください。