

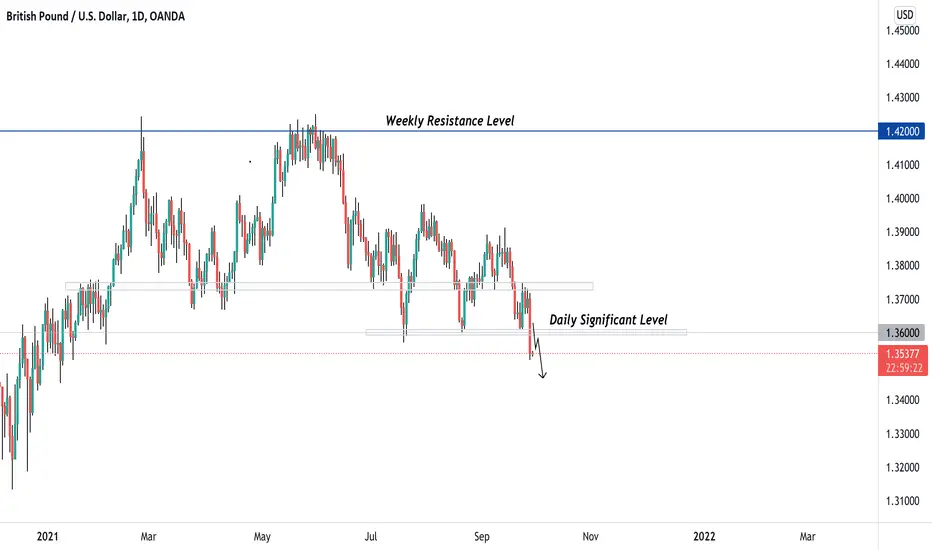
The market structure on GbpUsd seems to be shifting from a bullish to bearish sentiment on the daily timeframe. Ever since price has approached the Weekly Resistance Level, sellers have made themselves more apparent and clear downtrend structure has been established.
Scoping into the 4H charts, the most recent bearish candle has aggressively broke through the Daily Significant Level. This break in support could potentially indicate bearish strength, adding to the long-term bias as well. If we could retest this level as potential resistance and follow with strong bearish rejection, I'll be looking for sell opportunities.

免責事項
これらの情報および投稿は、TradingViewが提供または承認する金融、投資、取引、またはその他の種類の助言もしくは推奨であることを意図したものではなく、またこれらに該当するものでもありません。詳細は利用規約をご覧ください。
免責事項
これらの情報および投稿は、TradingViewが提供または承認する金融、投資、取引、またはその他の種類の助言もしくは推奨であることを意図したものではなく、またこれらに該当するものでもありません。詳細は利用規約をご覧ください。