

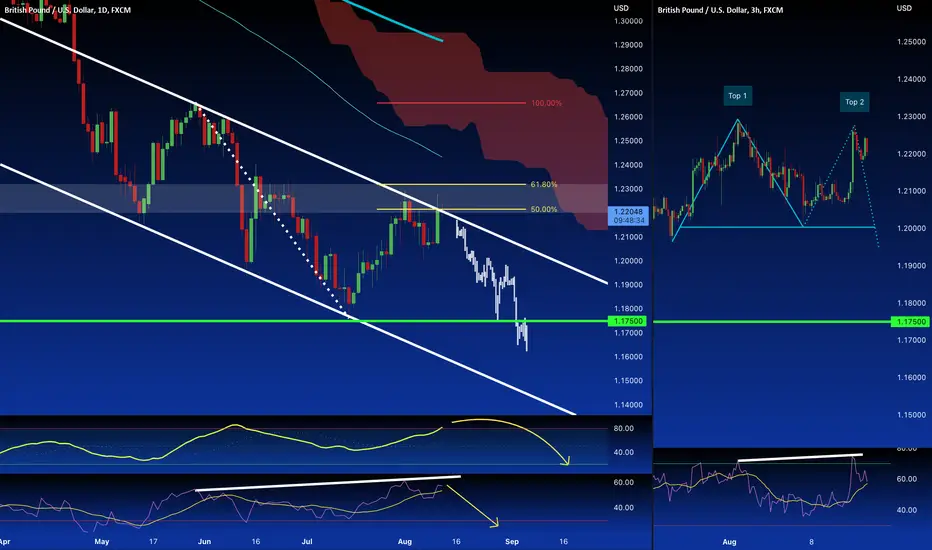
The GBP/USD in the lasts days It seemed was continue to follow the main trend but yesterday, after the CPI release news, had a Big Bullish candle and the price seems to retest again the Dynamic resistance given from the Bearish channel. The price is already inside the 50 / 61.8% Fibo levels and the Stochastic it's a comeback in the Overbought area. In the Daily timeframe note the Divergence on the RSI but, the value of this last one is Bullish. In the lower timeframe, on the left of the chart, we can see a Double Top formation with divergence and Overbought by the RSI, this can be a sign of a new starting Push down of the price. The situation is uncertain because the RSI in the D1 timeframe gave a Bullish sign meanwhile all the rest clues are Bearish. Our bias remains Bearish.
トレード稼働中

関連の投稿
免責事項
これらの情報および投稿は、TradingViewが提供または承認する金融、投資、取引、またはその他の種類の助言もしくは推奨であることを意図したものではなく、またこれらに該当するものでもありません。詳細は利用規約をご覧ください。
関連の投稿
免責事項
これらの情報および投稿は、TradingViewが提供または承認する金融、投資、取引、またはその他の種類の助言もしくは推奨であることを意図したものではなく、またこれらに該当するものでもありません。詳細は利用規約をご覧ください。