

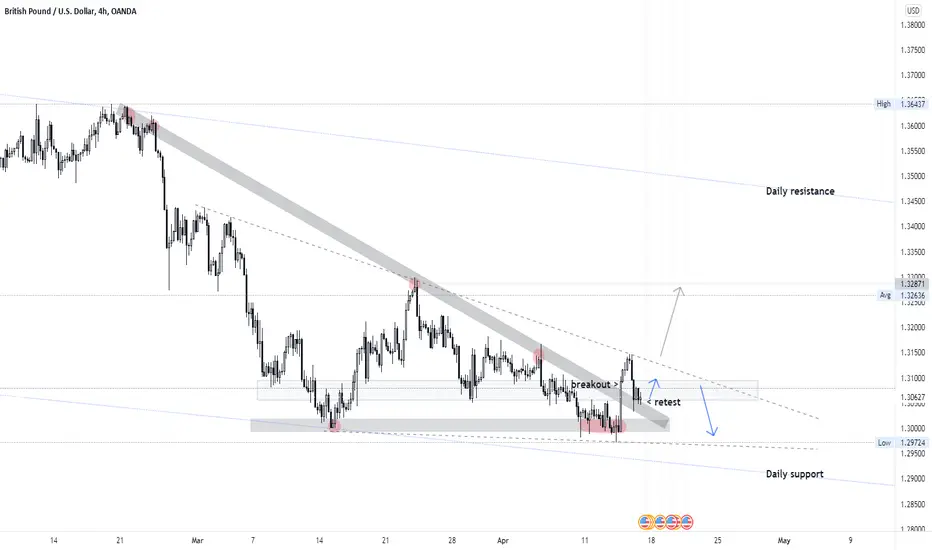
This is the technical analysis of GBPUSD H4. Based on chart pattern analysis. We can find a triangle and wedge pattern,
The direction of the trend is sideways tends to be bearish, there are economic data to be released, prices will fluctuate. we can take this opportunity to take a buy low - sell high :
1. The price is still moving in the pattern area.
2. Moderate buy action is possible, the price has retesting triangle area.
Risk : The UK economy does not seem to be in good shape relative to the U.S. with consumer confidence on the decline, rampant inflation and the end of free COVID-19 testing could add to negative data prints to come. A weaker than expected figure could add to bearish bets on the cable pairing.
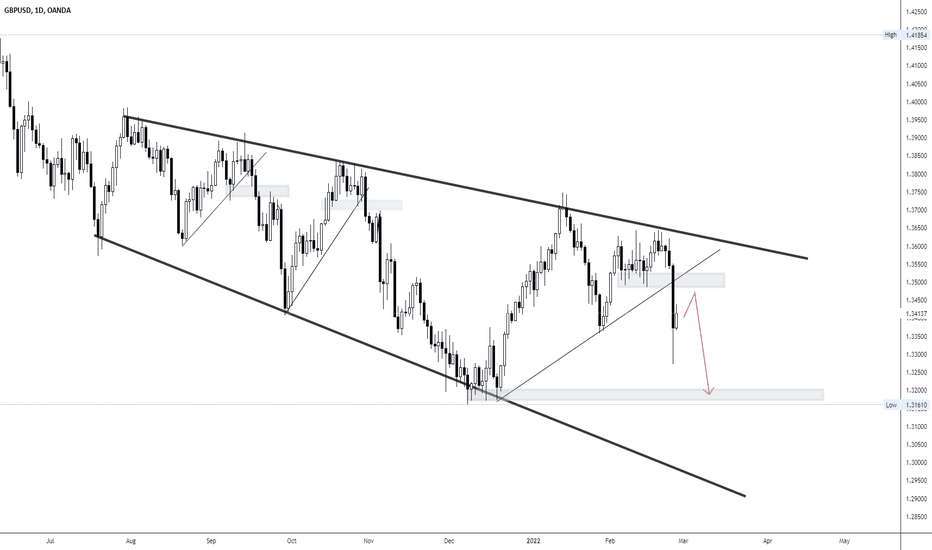
The direction of the trend is sideways tends to be bearish, there are economic data to be released, prices will fluctuate. we can take this opportunity to take a buy low - sell high :
1. The price is still moving in the pattern area.
2. Moderate buy action is possible, the price has retesting triangle area.
Risk : The UK economy does not seem to be in good shape relative to the U.S. with consumer confidence on the decline, rampant inflation and the end of free COVID-19 testing could add to negative data prints to come. A weaker than expected figure could add to bearish bets on the cable pairing.

関連の投稿
免責事項
これらの情報および投稿は、TradingViewが提供または承認する金融、投資、取引、またはその他の種類の助言もしくは推奨であることを意図したものではなく、またこれらに該当するものでもありません。詳細は利用規約をご覧ください。
免責事項
これらの情報および投稿は、TradingViewが提供または承認する金融、投資、取引、またはその他の種類の助言もしくは推奨であることを意図したものではなく、またこれらに該当するものでもありません。詳細は利用規約をご覧ください。