
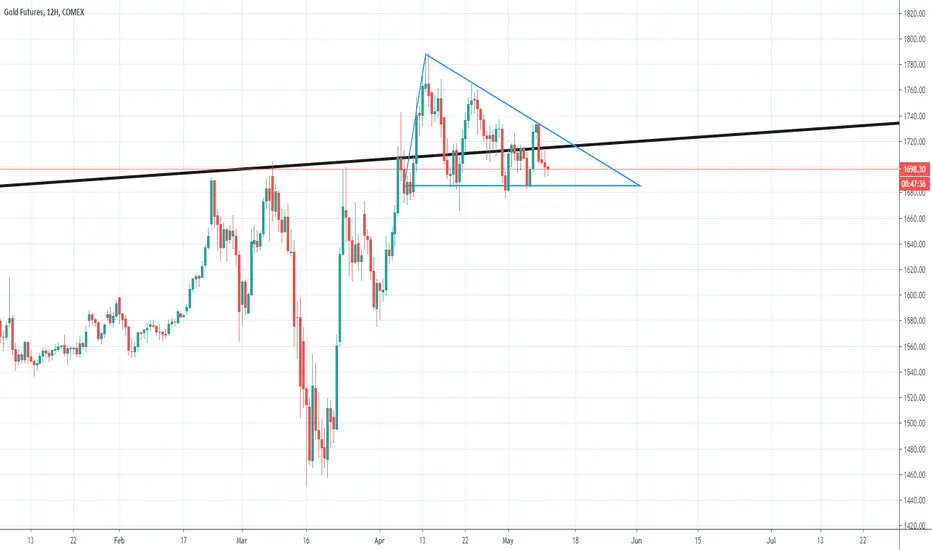
I have seen a couple of posts showing the current formation drawn as a symmetrical triangle, and that simply isn't the case. This is a descending triangle and the target gets the price action below the long term black trendline.
The monthly chart shows the situation quite clearly, and the situation is bearish.

The S&P is staged to dump, paper precious metals are going to dump into the grave with everything else as every bull in the trap gets their margin call.

The monthly chart shows the situation quite clearly, and the situation is bearish.
The S&P is staged to dump, paper precious metals are going to dump into the grave with everything else as every bull in the trap gets their margin call.

And I promise every Floridian that you will all be rich... because we're gonna print some more money! Why didn't anybody ever think of this before?
~Nathan Explosion
~Nathan Explosion
関連の投稿
免責事項
これらの情報および投稿は、TradingViewが提供または承認する金融、投資、取引、またはその他の種類の助言もしくは推奨であることを意図したものではなく、またこれらに該当するものでもありません。詳細は利用規約をご覧ください。
And I promise every Floridian that you will all be rich... because we're gonna print some more money! Why didn't anybody ever think of this before?
~Nathan Explosion
~Nathan Explosion
関連の投稿
免責事項
これらの情報および投稿は、TradingViewが提供または承認する金融、投資、取引、またはその他の種類の助言もしくは推奨であることを意図したものではなく、またこれらに該当するものでもありません。詳細は利用規約をご覧ください。