
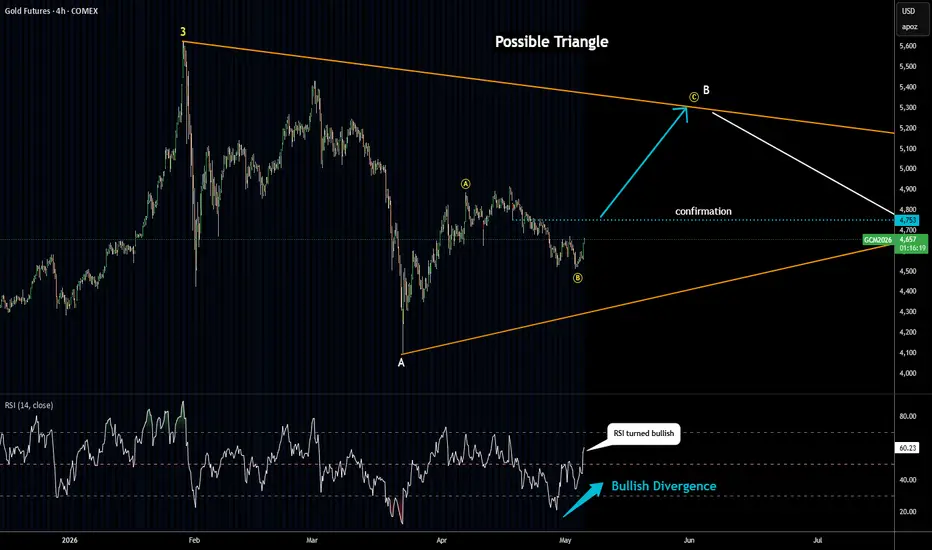
price moves along the established route as it sank
to preset Fibonacci retracement area
slashing half of previous growth in wave A of (B)
wave B of (B) looks completed, RSI shows Bullish Divergence and it already
crossed above the 50 "waterline", however it can dip one more time
confirmation for wave C of (B) is beyond $4,753 level where bottom
of wave 1 of B of (B) is located
target for wave C of (B) is at the top of possible triangle around $5,200-$5,300
where C = A of (B) and there is 76.4% Fibonacci retracement level

関連の投稿
免責事項
これらの情報および投稿は、TradingViewが提供または承認する金融、投資、取引、またはその他の種類の助言もしくは推奨であることを意図したものではなく、またこれらに該当するものでもありません。詳細は利用規約をご覧ください。
関連の投稿
免責事項
これらの情報および投稿は、TradingViewが提供または承認する金融、投資、取引、またはその他の種類の助言もしくは推奨であることを意図したものではなく、またこれらに該当するものでもありません。詳細は利用規約をご覧ください。