
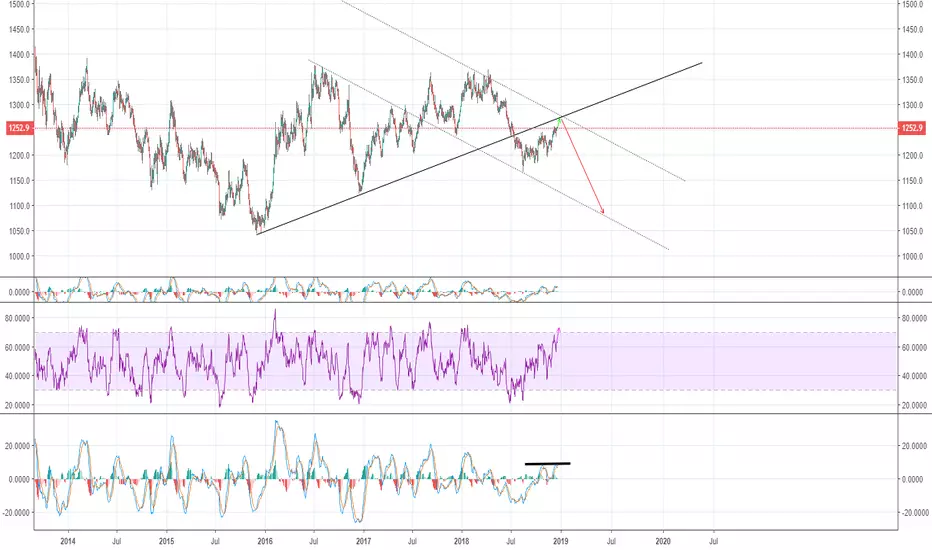
I believe we will hit the top of a downward channel by the end of the month.
1D chart RSI is very close to being overbought, one more price rally in the upward direction will result in the RSI achieving overbought status.
1D chart MACD's last movement failed to break the value of the previous macd wave. However price wise the second surge up was greater than the first surge. implying momentum is just about to come to a halt.
-Long; until the end of the month
-Short; as we enter 2019
1D chart RSI is very close to being overbought, one more price rally in the upward direction will result in the RSI achieving overbought status.
1D chart MACD's last movement failed to break the value of the previous macd wave. However price wise the second surge up was greater than the first surge. implying momentum is just about to come to a halt.
-Long; until the end of the month
-Short; as we enter 2019

免責事項
これらの情報および投稿は、TradingViewが提供または承認する金融、投資、取引、またはその他の種類の助言もしくは推奨であることを意図したものではなく、またこれらに該当するものでもありません。詳細は利用規約をご覧ください。
免責事項
これらの情報および投稿は、TradingViewが提供または承認する金融、投資、取引、またはその他の種類の助言もしくは推奨であることを意図したものではなく、またこれらに該当するものでもありません。詳細は利用規約をご覧ください。