
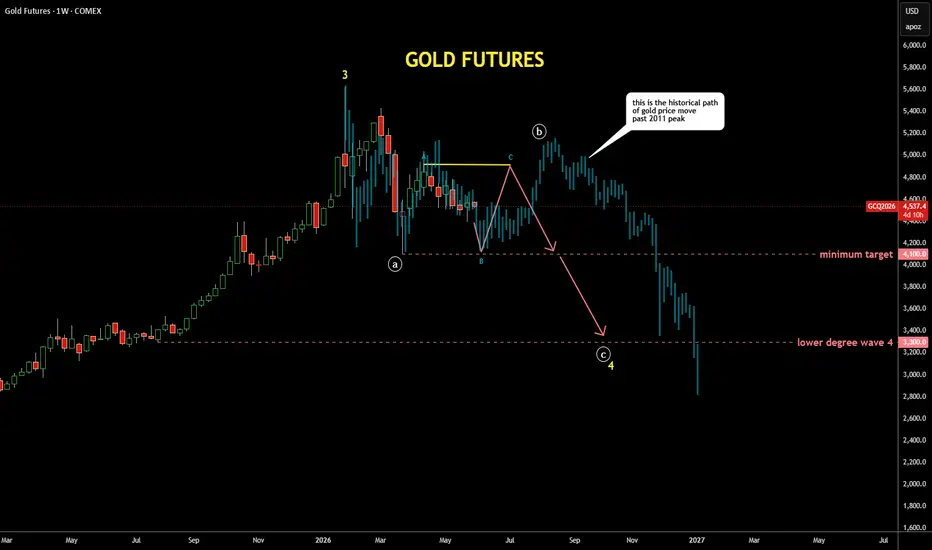
It's quite interesting exercise to check past patterns
if it is applicable to the current price structure
I scrolled back to distant 2011 where the gold peaked around $1,900,
copied the structure from there and pasted to the current peak
I fitted the bar pattern (faded blue bars) with tops and bottoms
It looks similar to the current structure as extremes align almost perfectly
It also matches with the map I posted earlier last week with bit more volatility
if it is applicable to the current price structure
I scrolled back to distant 2011 where the gold peaked around $1,900,
copied the structure from there and pasted to the current peak
I fitted the bar pattern (faded blue bars) with tops and bottoms
It looks similar to the current structure as extremes align almost perfectly
It also matches with the map I posted earlier last week with bit more volatility

関連の投稿
免責事項
これらの情報および投稿は、TradingViewが提供または承認する金融、投資、取引、またはその他の種類の助言もしくは推奨であることを意図したものではなく、またこれらに該当するものでもありません。詳細は利用規約をご覧ください。
免責事項
これらの情報および投稿は、TradingViewが提供または承認する金融、投資、取引、またはその他の種類の助言もしくは推奨であることを意図したものではなく、またこれらに該当するものでもありません。詳細は利用規約をご覧ください。