
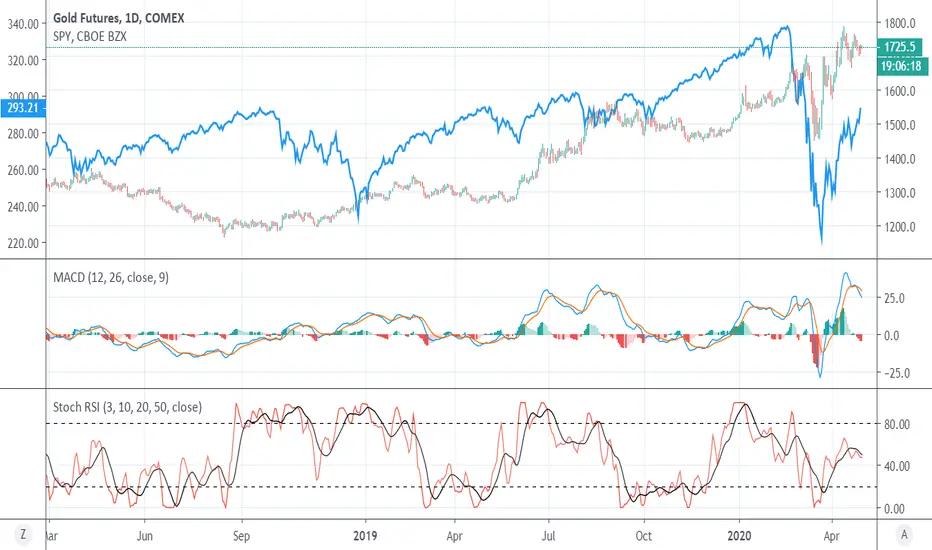
Gold Futures (GC) chart has been coiling on a daily chart, trading risk-on along side with SPY (SPX500). The main trend for gold is up. MACD and RSI charts are pointing downward. Secondary lower top has been formed. Yet, prices are holding up. FOMC decision to keep rates unchanged at 0.25% was bearish for traders hoping for negative rates. However, facing high unemployment numbers on 4/30/2020 and  DXY decline, gold may appreciate further. Pivot point: $1727.50. If bullish price action, then potential move up to $1764 - $1800. If bearish, then potential move down to $1682-$1660, which should serve as support.
DXY decline, gold may appreciate further. Pivot point: $1727.50. If bullish price action, then potential move up to $1764 - $1800. If bearish, then potential move down to $1682-$1660, which should serve as support. 
免責事項
これらの情報および投稿は、TradingViewが提供または承認する金融、投資、取引、またはその他の種類の助言もしくは推奨であることを意図したものではなく、またこれらに該当するものでもありません。詳細は利用規約をご覧ください。
免責事項
これらの情報および投稿は、TradingViewが提供または承認する金融、投資、取引、またはその他の種類の助言もしくは推奨であることを意図したものではなく、またこれらに該当するものでもありません。詳細は利用規約をご覧ください。