
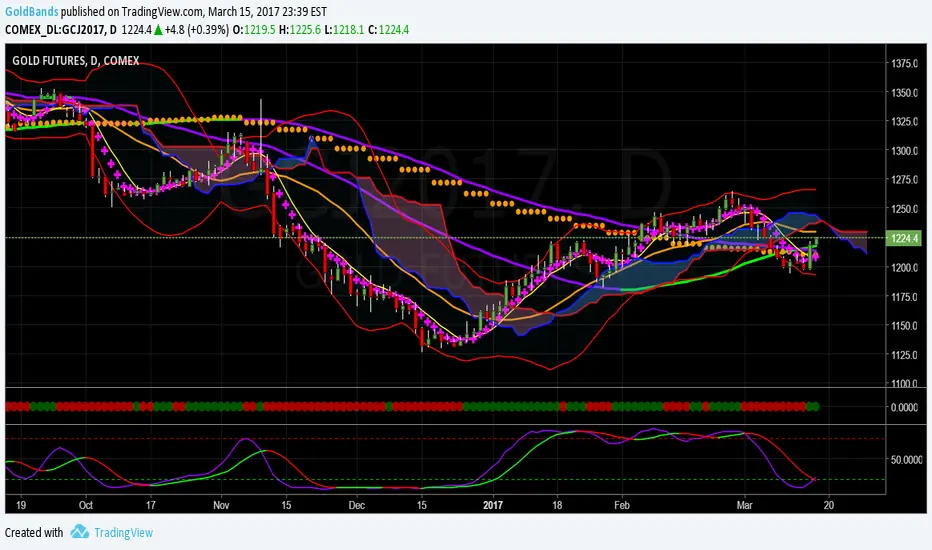
The Fed today announced an increase in the Fed rate. This was not a surprise. What was surprising is the Gold rally that followed. In fact, Gold blasted through all resistance levels, including the 6 and 8 day moving averages, the 50 day moving average and the 21 weekly moving average.
The Heikin-Ashi chart also shows a dramatic change of direction (see below)

Now the question is where is Gold going. First, when price breaks the 6 day moving average, statistically speaking, there is a high probability will price will hit the 21 day moving average. Right now, that's at ~1230. My next target would be the top Bollinger Band. That's currently at 1265. This is what I call a coast to coast trade. After that, well, we'll evaluate that in the days to come.

The last chart tonight is the Volume Profile chart. Notice that the short and intermediate term POC is at 1230. This will act like a magnet to price and makes another good target.
Disclaimer: This post is for educational purposes only. Trade at your own risk.
The Heikin-Ashi chart also shows a dramatic change of direction (see below)
Now the question is where is Gold going. First, when price breaks the 6 day moving average, statistically speaking, there is a high probability will price will hit the 21 day moving average. Right now, that's at ~1230. My next target would be the top Bollinger Band. That's currently at 1265. This is what I call a coast to coast trade. After that, well, we'll evaluate that in the days to come.
The last chart tonight is the Volume Profile chart. Notice that the short and intermediate term POC is at 1230. This will act like a magnet to price and makes another good target.
Disclaimer: This post is for educational purposes only. Trade at your own risk.

関連の投稿
免責事項
これらの情報および投稿は、TradingViewが提供または承認する金融、投資、取引、またはその他の種類の助言もしくは推奨であることを意図したものではなく、またこれらに該当するものでもありません。詳細は利用規約をご覧ください。
免責事項
これらの情報および投稿は、TradingViewが提供または承認する金融、投資、取引、またはその他の種類の助言もしくは推奨であることを意図したものではなく、またこれらに該当するものでもありません。詳細は利用規約をご覧ください。