
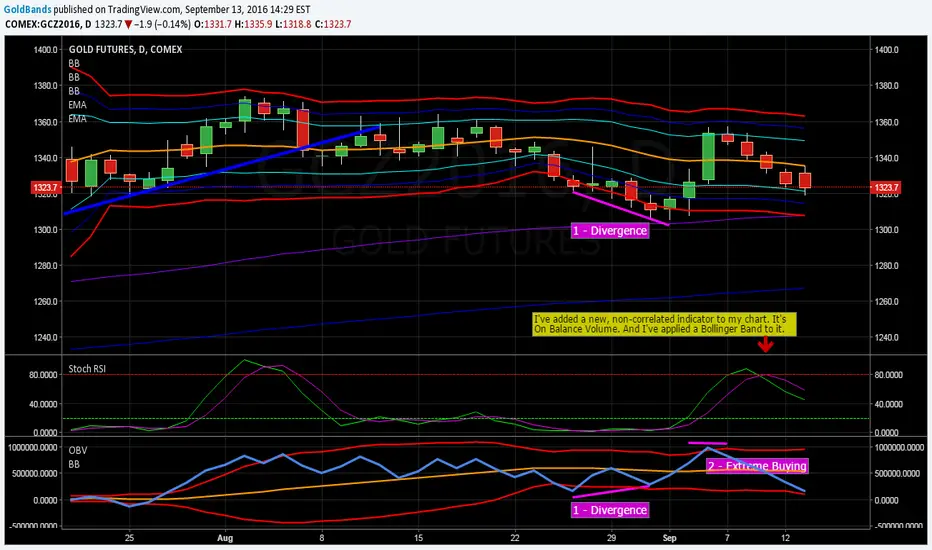
I've added OBV to my chart as a non-correlated indicator. I did this because I wanted a volume indicator as recommended by John Bollinger. I've seen some people add a fast EMA to the indicator but I like how the Bollinger Bands show the extremes.
I've highlighted 2 examples.
1. Classic Divergence - As price exceeded the lower bollinger band in the price fall at the end of August, you can see the OVB make a higher low after it crossed below then back above the lower BB. A nice long trade followed.
2. The first day after Labor Day saw gold have a huge day up. As price hit the upper cyan BB (Std Dev 1.0), the OBV also showed all the buying pressure. That signaled the end of the buying as OBV dropped the next day. You can see that it preceeded the Stoch RSI crossover by a day. GC
GC
I've highlighted 2 examples.
1. Classic Divergence - As price exceeded the lower bollinger band in the price fall at the end of August, you can see the OVB make a higher low after it crossed below then back above the lower BB. A nice long trade followed.
2. The first day after Labor Day saw gold have a huge day up. As price hit the upper cyan BB (Std Dev 1.0), the OBV also showed all the buying pressure. That signaled the end of the buying as OBV dropped the next day. You can see that it preceeded the Stoch RSI crossover by a day.
GC
関連の投稿
免責事項
これらの情報および投稿は、TradingViewが提供または承認する金融、投資、取引、またはその他の種類の助言もしくは推奨であることを意図したものではなく、またこれらに該当するものでもありません。詳細は利用規約をご覧ください。
免責事項
これらの情報および投稿は、TradingViewが提供または承認する金融、投資、取引、またはその他の種類の助言もしくは推奨であることを意図したものではなく、またこれらに該当するものでもありません。詳細は利用規約をご覧ください。