
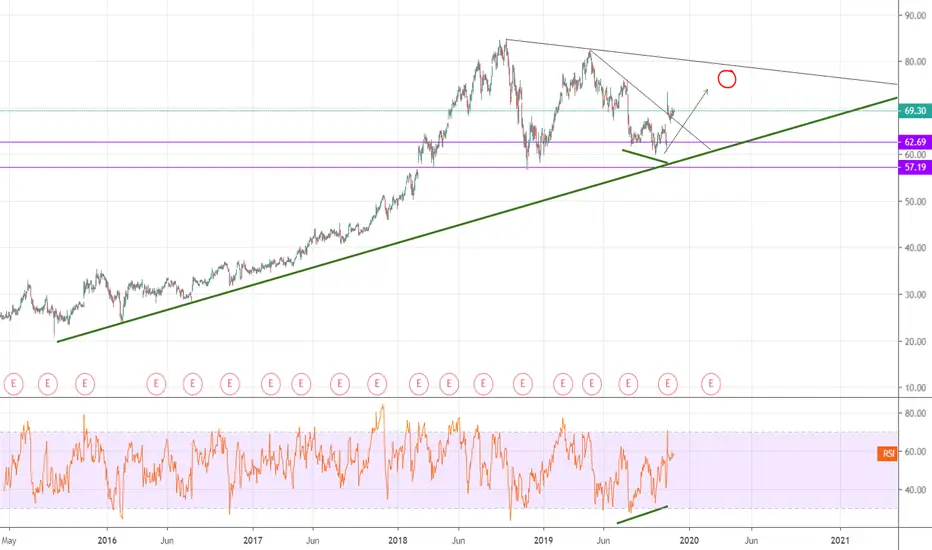
On the 1 day chart we see a Bullish Divergence appear generally indicating a reversal alongside a broken trendline, as GoDaddy announced stronger than expected financials Q3. Average analyst target price is reading $89 for 12 months. Expect resistance around $75
ノート
Awaiting signal form Moving Averages, price has jumped above MA 200 line. Price may bounce off blue 13MA line, which would be short term support and could lead to another bullish signal, which we may see 'Golden Cross' signal when the gold 50MA crosses over the red 100MA.
トレード終了: 利益確定目標に到達

免責事項
これらの情報および投稿は、TradingViewが提供または承認する金融、投資、取引、またはその他の種類の助言もしくは推奨であることを意図したものではなく、またこれらに該当するものでもありません。詳細は利用規約をご覧ください。
免責事項
これらの情報および投稿は、TradingViewが提供または承認する金融、投資、取引、またはその他の種類の助言もしくは推奨であることを意図したものではなく、またこれらに該当するものでもありません。詳細は利用規約をご覧ください。