
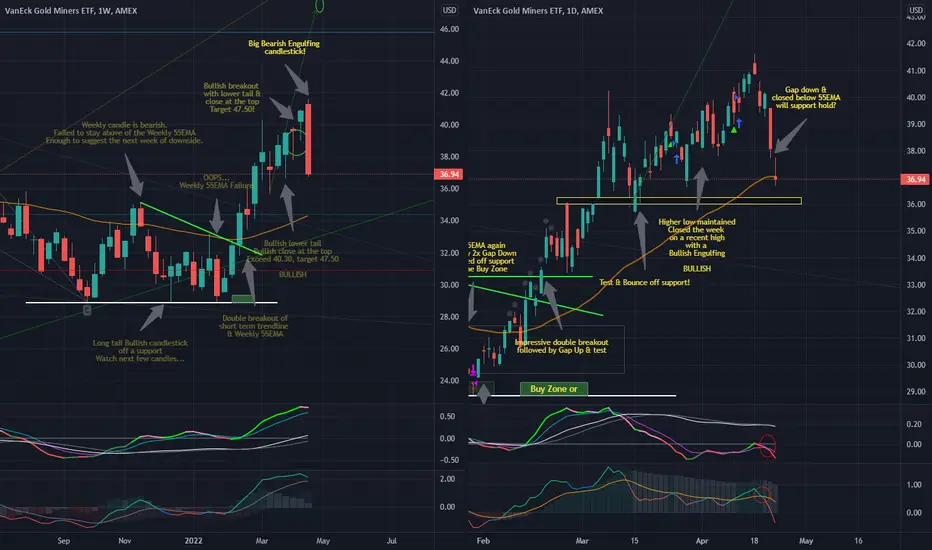
In the last week, GDX erased the bullishness of the preceding month with one fell swoop of an Bearish Engulfing kind (weekly chart).
So expecting continued bearish candles would be expected as it follows through.
The daily chart supports that view so far, and it just broke down of the 55EMA, after a gap down. The good thing is that it did not really gap and run... at least not yet.
Technicals are overall bearish, at least for a bit. Expecting bounces off 36, maybe even 35.
So expecting continued bearish candles would be expected as it follows through.
The daily chart supports that view so far, and it just broke down of the 55EMA, after a gap down. The good thing is that it did not really gap and run... at least not yet.
Technicals are overall bearish, at least for a bit. Expecting bounces off 36, maybe even 35.

関連の投稿
免責事項
これらの情報および投稿は、TradingViewが提供または承認する金融、投資、取引、またはその他の種類の助言もしくは推奨であることを意図したものではなく、またこれらに該当するものでもありません。詳細は利用規約をご覧ください。
免責事項
これらの情報および投稿は、TradingViewが提供または承認する金融、投資、取引、またはその他の種類の助言もしくは推奨であることを意図したものではなく、またこれらに該当するものでもありません。詳細は利用規約をご覧ください。