
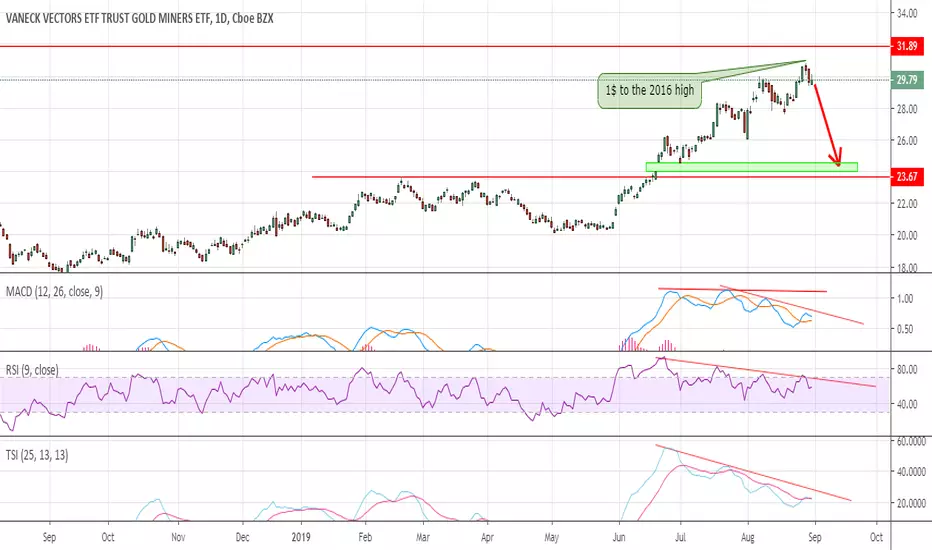
I think the GDX rally is done too.
All the indicators are showing divergencies in GDX.
It rallied almost to the 2016 highs...

We will get a pinbar ( inverted hammer or shooting star ) on the weekly chart.
The weekly chart's indicators need to tag the oversold territory in this decline.
It might close the gap at 24 -24.56 or might test breakout at 23.67$.
All the indicators are showing divergencies in GDX.
It rallied almost to the 2016 highs...
We will get a pinbar ( inverted hammer or shooting star ) on the weekly chart.
The weekly chart's indicators need to tag the oversold territory in this decline.
It might close the gap at 24 -24.56 or might test breakout at 23.67$.
ノート
Broke down the trendline today. If it stays there into the close more selling will come on Monday.ノート
After today's big bounce we are closing in the red. Big guys dumped their shares to the small guys. I hope nobody bought the fake rally today.
手動でトレードを終了しました
ノート
Just in case if it turns out to be a double bottom
関連の投稿
免責事項
これらの情報および投稿は、TradingViewが提供または承認する金融、投資、取引、またはその他の種類の助言もしくは推奨であることを意図したものではなく、またこれらに該当するものでもありません。詳細は利用規約をご覧ください。
免責事項
これらの情報および投稿は、TradingViewが提供または承認する金融、投資、取引、またはその他の種類の助言もしくは推奨であることを意図したものではなく、またこれらに該当するものでもありません。詳細は利用規約をご覧ください。