
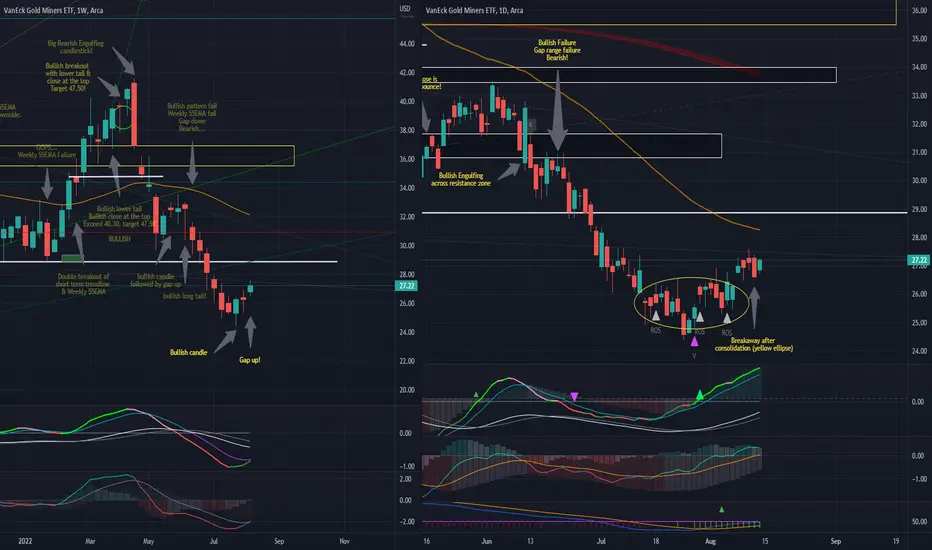
Quick note that the GDX is finally recovering.
After about 8 weeks, and a consolidation range, the GDX appears to be recovering with a nice gap up on the weekly chart. Technical indicators are turning up, and the daily chart would be testing the 55EMA soon...
29 appears to be a very strong resistance to break.
After about 8 weeks, and a consolidation range, the GDX appears to be recovering with a nice gap up on the weekly chart. Technical indicators are turning up, and the daily chart would be testing the 55EMA soon...
29 appears to be a very strong resistance to break.

関連の投稿
免責事項
これらの情報および投稿は、TradingViewが提供または承認する金融、投資、取引、またはその他の種類の助言もしくは推奨であることを意図したものではなく、またこれらに該当するものでもありません。詳細は利用規約をご覧ください。
関連の投稿
免責事項
これらの情報および投稿は、TradingViewが提供または承認する金融、投資、取引、またはその他の種類の助言もしくは推奨であることを意図したものではなく、またこれらに該当するものでもありません。詳細は利用規約をご覧ください。