
Good morning Traders. How was the weekend ? Another trading week will start soon. so let's dig in.
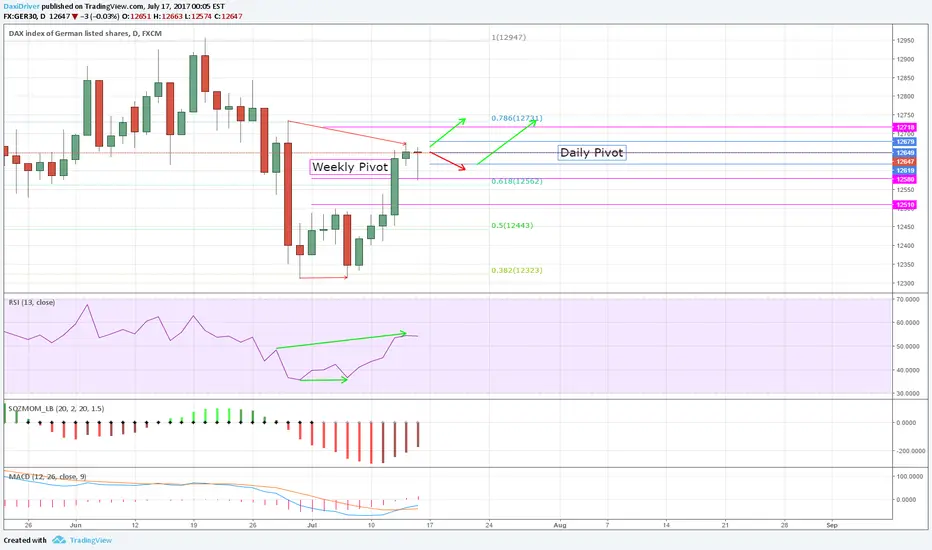
The daily chart look's BULLISH. with US new high, looks like we heading towards 12730 - 12750.
BUT before we run and buy, we should look deeper
The 2hr chart is more BEARISH, so we can expect so some sell before US market opens.
not to mention that US might sell off a bit after weekend rally.
s3.amazonaws.com/tradingview/snapshots/o/OW62dgK6.png
Remember, you dont have to jump in. you can use the WEEKLY and DAILY pivots to try and enter.
the logic with pivots is - if price goes up towards S1 (top line) you might consider sell if it doesn't go above.
if price goes down towards P1 (bottom line) you can consider LONG if it won't breaks below the line.
The daily chart look's BULLISH. with US new high, looks like we heading towards 12730 - 12750.
BUT before we run and buy, we should look deeper
The 2hr chart is more BEARISH, so we can expect so some sell before US market opens.
not to mention that US might sell off a bit after weekend rally.
s3.amazonaws.com/tradingview/snapshots/o/OW62dgK6.png
Remember, you dont have to jump in. you can use the WEEKLY and DAILY pivots to try and enter.
the logic with pivots is - if price goes up towards S1 (top line) you might consider sell if it doesn't go above.
if price goes down towards P1 (bottom line) you can consider LONG if it won't breaks below the line.
ノート
I think its going upS&p got more 10 points to give
s3.amazonaws.com/tradingview/snapshots/5/5SBrc3TG.png

免責事項
これらの情報および投稿は、TradingViewが提供または承認する金融、投資、取引、またはその他の種類の助言もしくは推奨であることを意図したものではなく、またこれらに該当するものでもありません。詳細は利用規約をご覧ください。
免責事項
これらの情報および投稿は、TradingViewが提供または承認する金融、投資、取引、またはその他の種類の助言もしくは推奨であることを意図したものではなく、またこれらに該当するものでもありません。詳細は利用規約をご覧ください。